
Discovery and Basic Research
Zakia Belhadj, PhD
Post-Doc
University of Minnesota
Minneapolis, Minnesota, United States
Zakia Belhadj, PhD
Post-Doc
University of Minnesota
Minneapolis, Minnesota, United States
Thamina Akther, Ph.D.
Postdoc
University of Minnesota
Minneapolis, Minnesota, United States
Zhengqiang Wang, Ph.D.
Professor, Center for Drug Design (CDD)
University of Minnesota
Minneapolis, Minnesota, United States
Jiashu Xie, Ph.D.
Assistant Professor, Center for Drug Design (CDD)
University of Minnesota
Minneapolis, Minnesota, United States
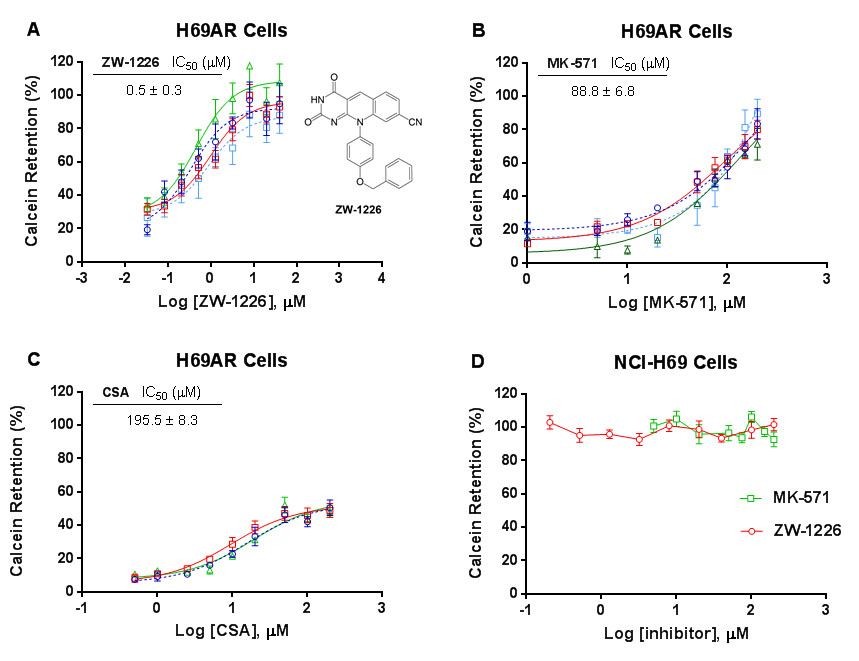 Figure 1. Inhibitory effect of ZW-1226 on calcein accumulation in MRP1-overexpressing H69AR cells. Representative dose-response curves of ZW-1226 (A), MK-571 (B), and CSA (C) in H69AR cells and NCI-H69 cells (D) using calcein retention assays. Calcein retention (%) indicates the proportion of calcein retained in H69AR cells compared to the parental NCI-H69 cells. For drug-treated NCI-H69 cells, this percentage represents the proportion of calcein retained in these cells compared to those treated with DMSO. Data are shown as mean ± SD from at least three independent studies (n ≥ 3).
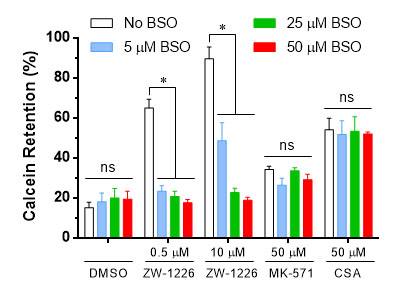 Figure 2. Calcein retention in MRP1-overpressing H69AR cells with or without BSO pretreatment. Calcein retention (%) indicates the proportion of calcein retained in H69AR cells compared to the parental NCI-H69 cells. Data are shown as mean ± SD from three independent studies (n =3). One way or two-way ANOVA. *: p < 0.05. ns: not significant.
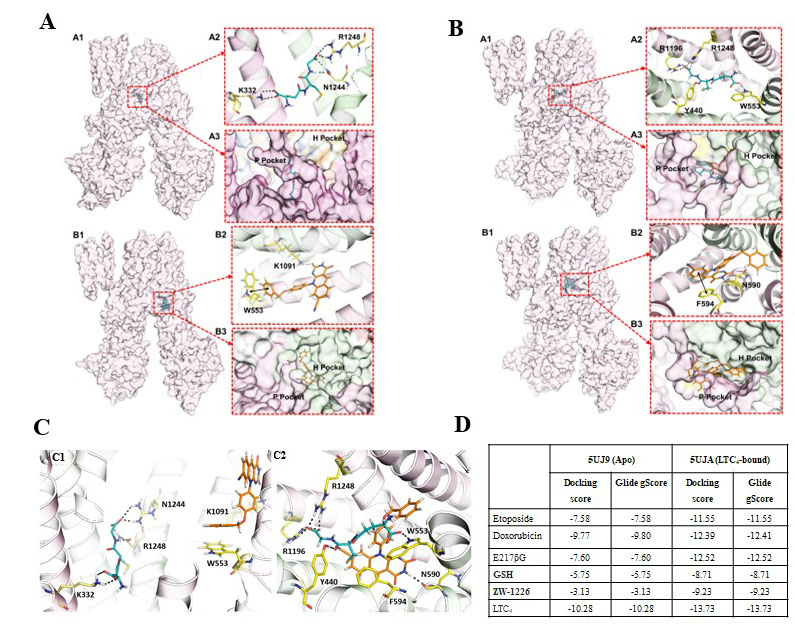 Figure 3. Molecular docking of ZW-1226 and GSH. (A) Docking of GSH and ZW-1226 with the apo bovine MRP1 (5UJ9). A1 and B1: the surface representations of apo bovine MRP1 docked with GSH and ZW-1226, respectively. A2 and B2: the cartoon representations of the domain structure of MRP1 with compound GSH and ZW-1226, respectively. (B) Docking of the GSH and ZW-1226 with the LCT4 bound bovine MRP1 (5UJA). A1 and B1: the surface representations of LCT4 bound bovine MRP1 docked with GSH and ZW-1226, respectively. A2 and B2: the cartoon representations of the domain structure of MRP1 with compound GSH and ZW-1226, respectively. (C) Overlay representation of GSH and ZW-1226. C1 and C2: docking overlay of GSH (teal blue) and ZW-1226 (orange) with the apo bovine MRP1 (5UJ9) and LTC4 bound bovine MRP1 (5UJA), respectively. (D) Docking scores of Etoposide, Doxorubicin, Estradiol-17β-d-glucuronide (E217βG), GSH, ZW-1226, and LTC4.