
Discovery and Basic Research

Hugo Gagnon, PhD
CSO
Allumiqs
Sherbrooke, Quebec, Canada
Hugo Gagnon, PhD
CSO
Allumiqs
Sherbrooke, Quebec, Canada
Jean-Francois Noel, Ph.D.
Sr. Scientific manager
Allumiqs
Sherbrooke, Quebec, Canada
Simon Perrin, Ph.D.
Sr. Scientist
Allumiqs
Sherbrooke, Quebec, Canada
Jessica Nickerson, Ph.D.
Scientist
Allumiqs
Sherbrooke, Quebec, Canada
Victoria Milller, Ph.D.
Scientist R&D manager
Allumiqs
Sherbrooke, Quebec, Canada
Ariss Alimi, MS
ML and Bioinformatics Scientist
Simmunome Inc.
montreal, Quebec, Canada
Nardin Nakhla, Ph.D.
CTO
Simmunome Inc.
montreal, Quebec, Canada
Armstrong Murira, Ph.D.
CEO
Simmunome Inc.
montreal, Quebec, Canada
Anik Chevrier, Ph.D.
Research associate
Polytechnique Montreal
Monteral, Quebec, Canada
Marc Lavertu, Ph.D.
Associate Professor
Polytechnique Montréal
Montreal, Quebec, Canada
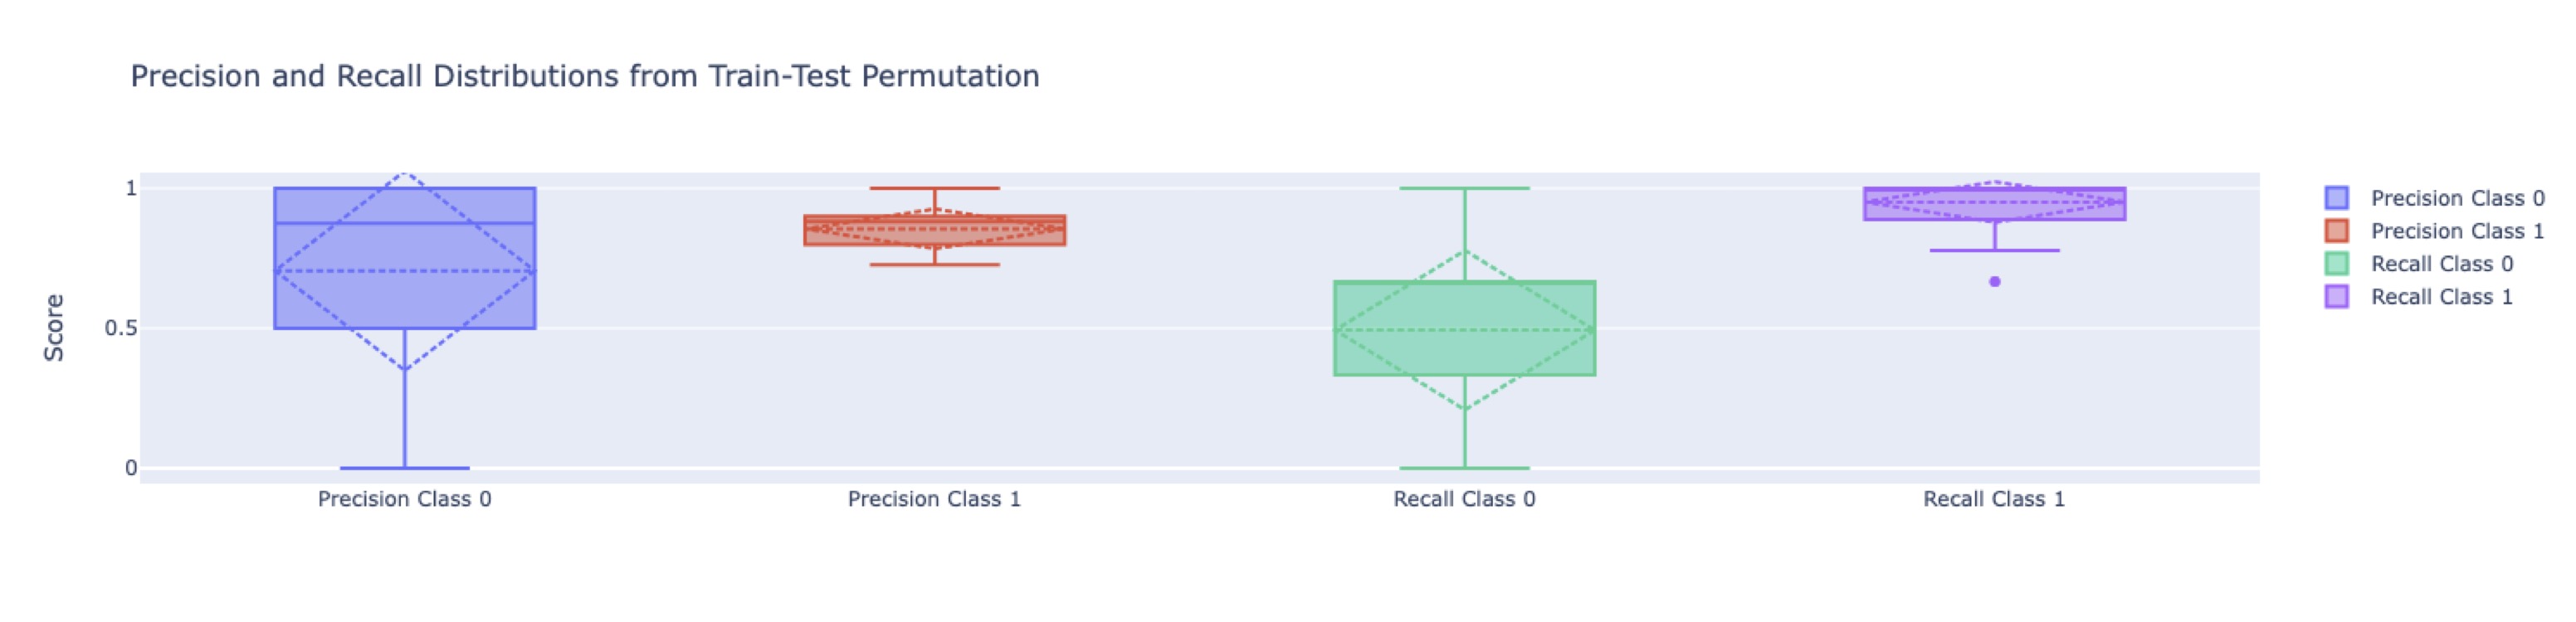 Figure 1 - Low model performance when using all feature. SVM model was used to evaluate Precision (True positive rate) and Recall (ability to classify all object of the target class) following Train/test permutation. Class 0 in old PRP and Class 1 is young PRP. Permutation of Train test groups allows to see the distribution of the Precision and Recall and is a good indicator of the quality of the ML model. We see that without features selection SVM model has poor performance predicting old PRP and achieved it with very high variability.
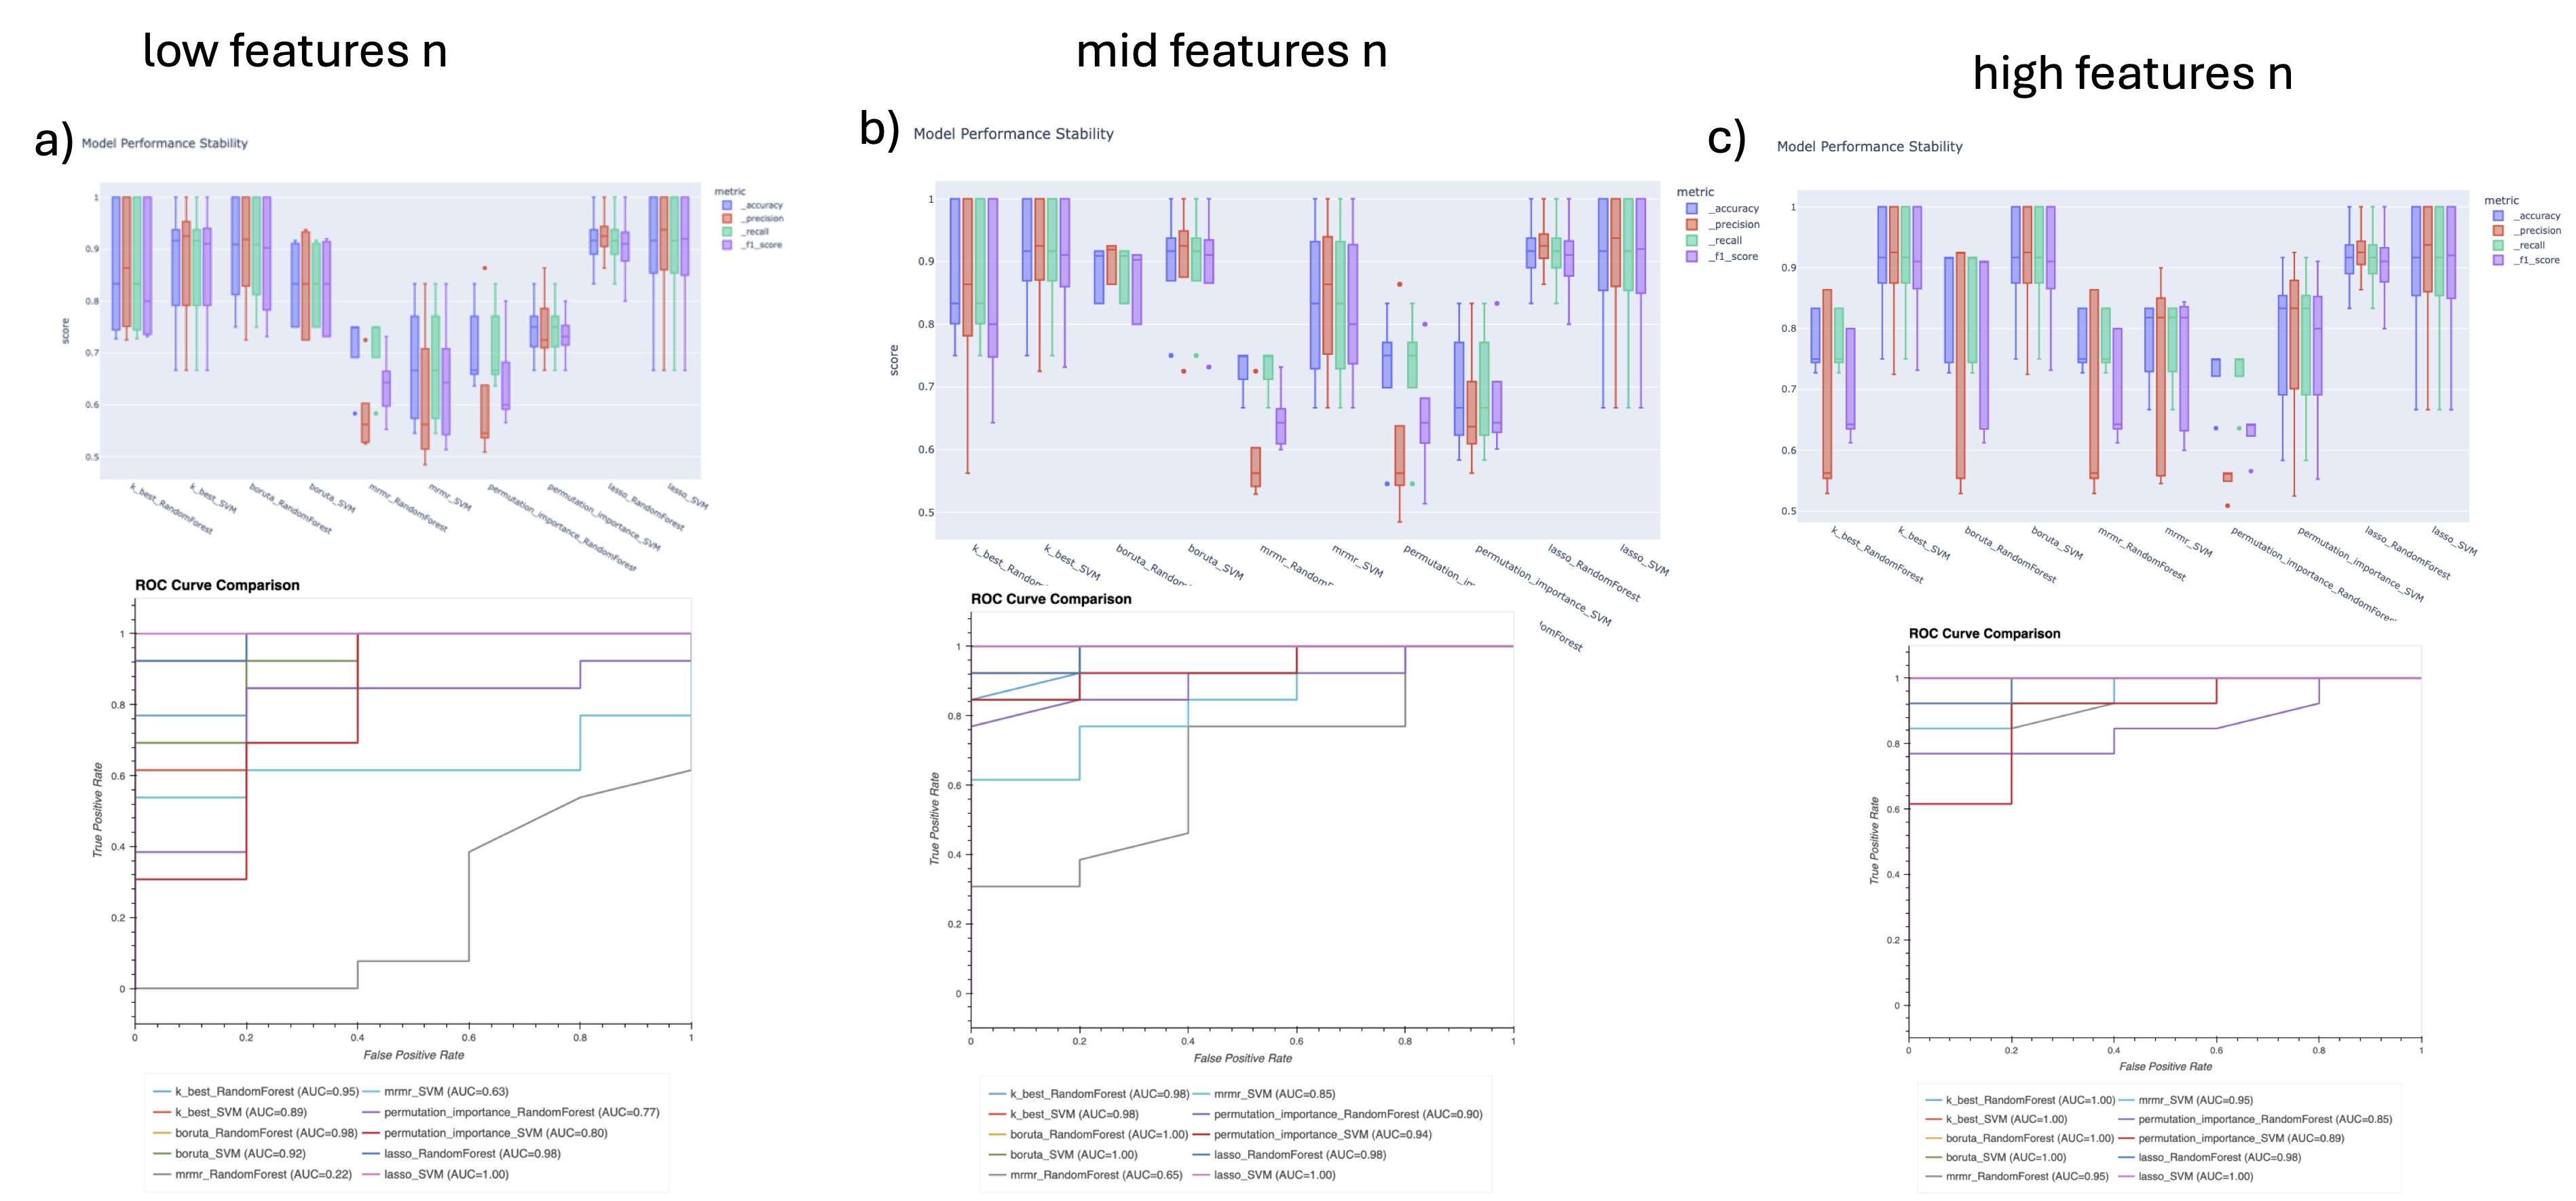 Figure 2 - Models metrics vs selections methods. 4 features selection method was tested to build machine learning based classifier (RF and SVM). Each method was tested a 3 different level of number of features (20 a), 100 b), 200 c)) when possible. Lasso doesn't allows to perform such selection, so it remains the same across test. Boruta doesn't allow to output a determined number of features put a stringency setting was used to output a similar number of features. Bottom pane present the ROC (receiver operating characteristic curve) for each pair and top present train/test permutation results on model precision, accuracy, recall and f1 score (a measure of predictive performance overall).
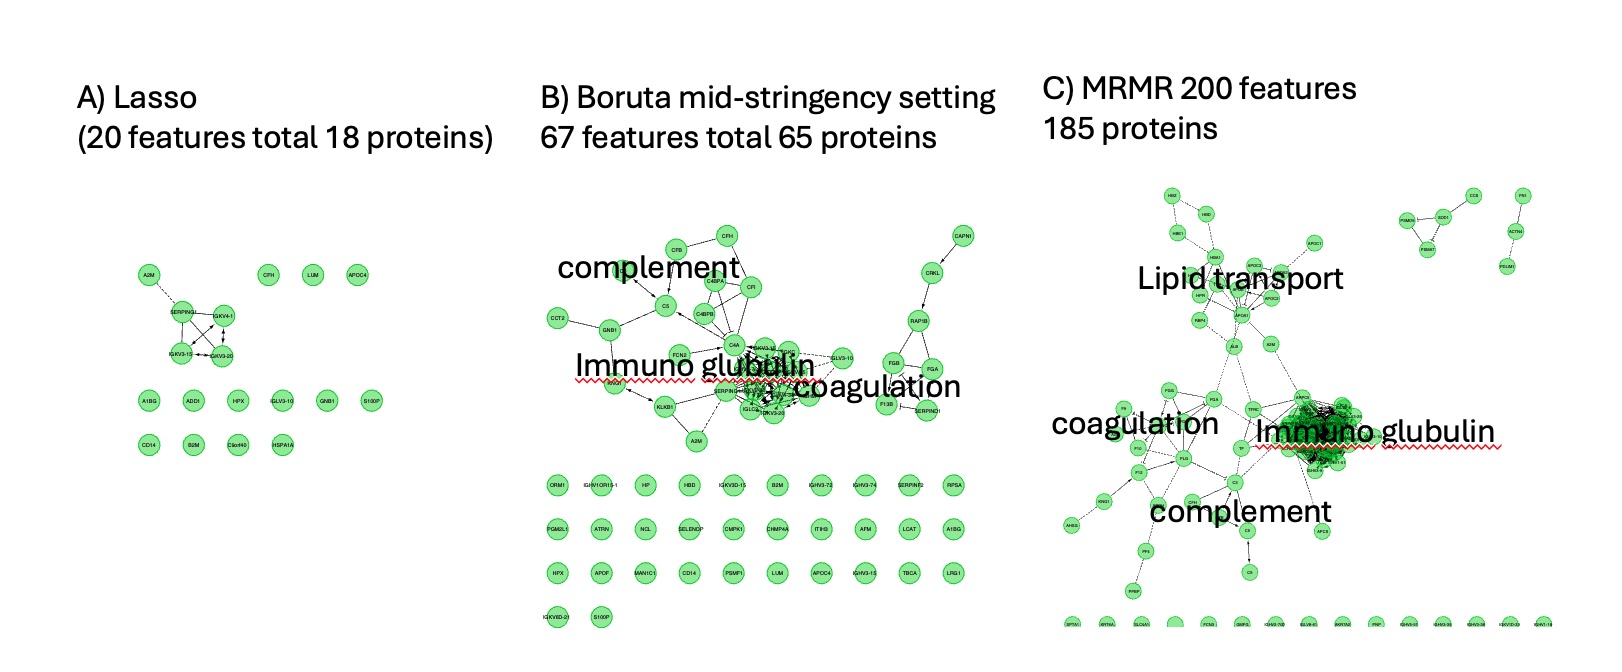 Figure 3 - Effect of features selection method on biological interpretability. Comparison of Reactom protein network of selected features. A) Lasso method, B) Boruta method with a percent setting at .9 and C) MRMR method with 200 selected features. Although MRMR method gave leaser performance in classification using RF and SVM, because more features were kept it's easier to interpret using GO and pathway analysis. We see key clusters of proteins having a define function. We see that B) still represent those key pathway ways in general but A) completely loses biological interpretability. However, A) still keep key proteins that are seen in C). This suggests we could perform features grouping prior to features selection to keep biological interpretability.