
Formulation and Delivery - Chemical

Mohammad Alnatour, PhD
Postdoctoral Research Scholar
University of Iowa
Iowa City, Iowa, United States
Mohammad Alnatour, PhD
Postdoctoral Research Scholar
University of Iowa
Iowa City, Iowa, United States
Leela Sai Lokesh Janardhanam, Ph.D.
Postdoctoral Fellow
University of Iowa
Iowa City, Iowa, United States

Ramkrishna Sen, PhD
Postdoctoral Fellow
University of Iowa
Iowa City, Iowa, United States
Sean Geary, Ph.D.
Assistant Research Scientist
University of Iowa
Iowa City, Iowa, United States

Aliasger K. Salem, Ph.D.
Associate Vice President for Research
University of Iowa
Iowa City, Iowa, United States
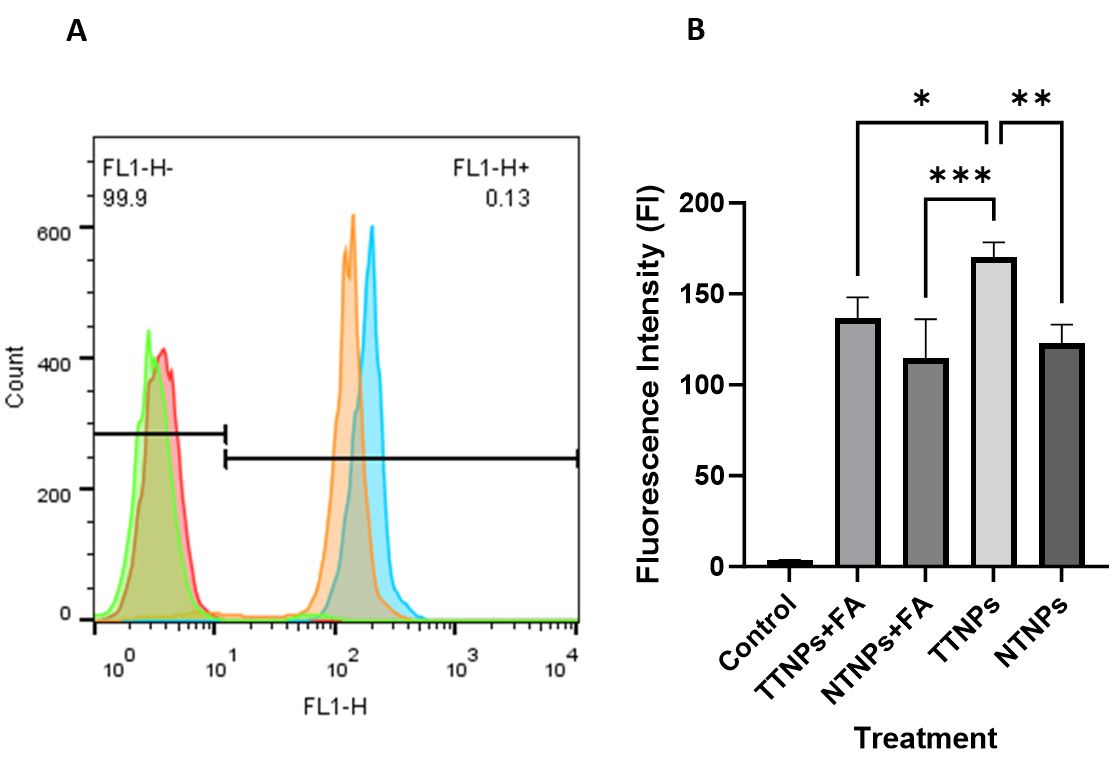 Figure 1: In vitro cellular uptake of TTNPs and NTNPs loaded with C6. A) Flow cytometric overlays of CT26 cells treated with C6-TTNPs (Blue), C6-NTNPs (Orange), and blank-TTNPs (Pink) at a concentration 100 µg/mL for 1 hour in addition to untreated control (Green). B) Flow cytometric-generated relative mean fluorescence intensities of CT26 exposed to TTNPs with pretreatment with 1 mM folic acid TTNPs+FA, NTNPs with pretreatment with 1 mM folic acid NTNPs+FA, TTNPs and NTNPs respectively. n=4, one-way ANOVA, * p-value < 0.05 and ** p-value < 0.01, *** p-value < 0.001.
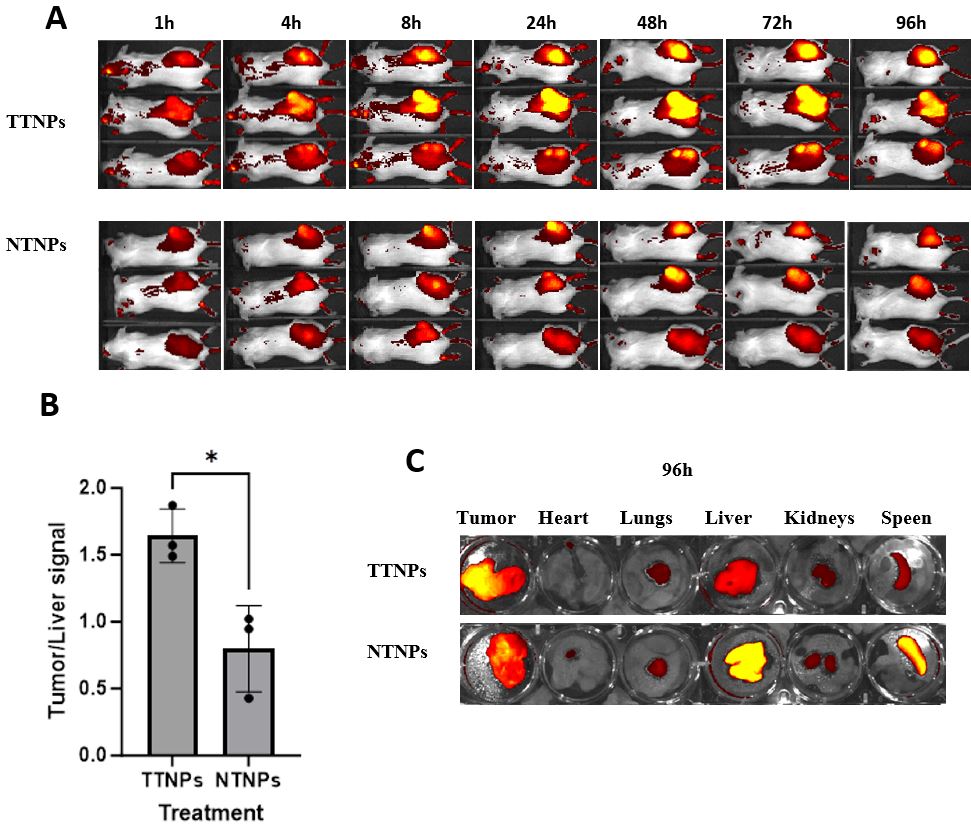 Figure 2: (A) Real-time whole-body imaging of CT26 tumor-bearing female BALB/C mice at different time points after tail vein injection of DiR-loaded TTNPs and DiR-loaded NTNPs at a dose of 4 mg per mouse, dorsal view. (B) Quantitative image analysis by relative fluorescent intensity per unit area as Tumor/Liver ratio, n=3, t-test, * p-value < 0.05. (C) Ex vivo images of tumor and major organs (heart, lungs, liver, kidneys and spleen) 96 h post-intravenous injection.
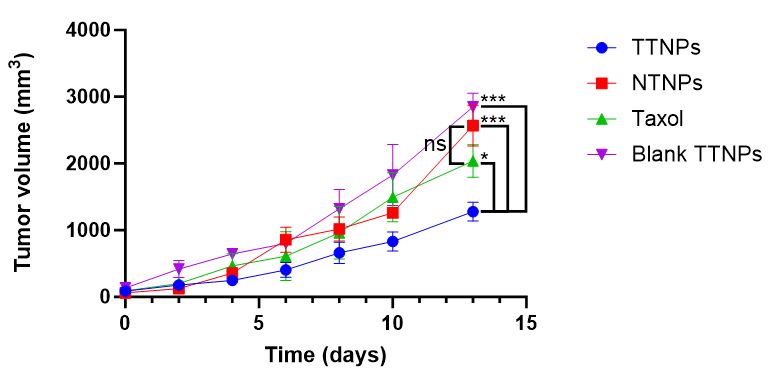 Figure 3: Tumor growth profiles for CT26 tumor-bearing BALB/C mice, I.V. injected with PTX-loaded TTNPs, NTNPs, Taxol, or blank TTNPs. n=3-4. Dose of PTX/Taxol was 10 mg/kg. Statistical analysis was performed using a one-way ANOVA. Data are presented as mean ± SD. * p-value < 0.05, *** p-value <0.001.