
Formulation and Delivery - Biomolecular
.jpg "Bishal Misra, MS photo")
Bishal Misra, MS
Ph. D. candidate
West Virginia University
Morgantown, West Virginia, United States
Sharan Bobbala, Ph.D. (he/him/his)
Assistant Professor
West Virginia University
Morgantown, West Virginia, United States
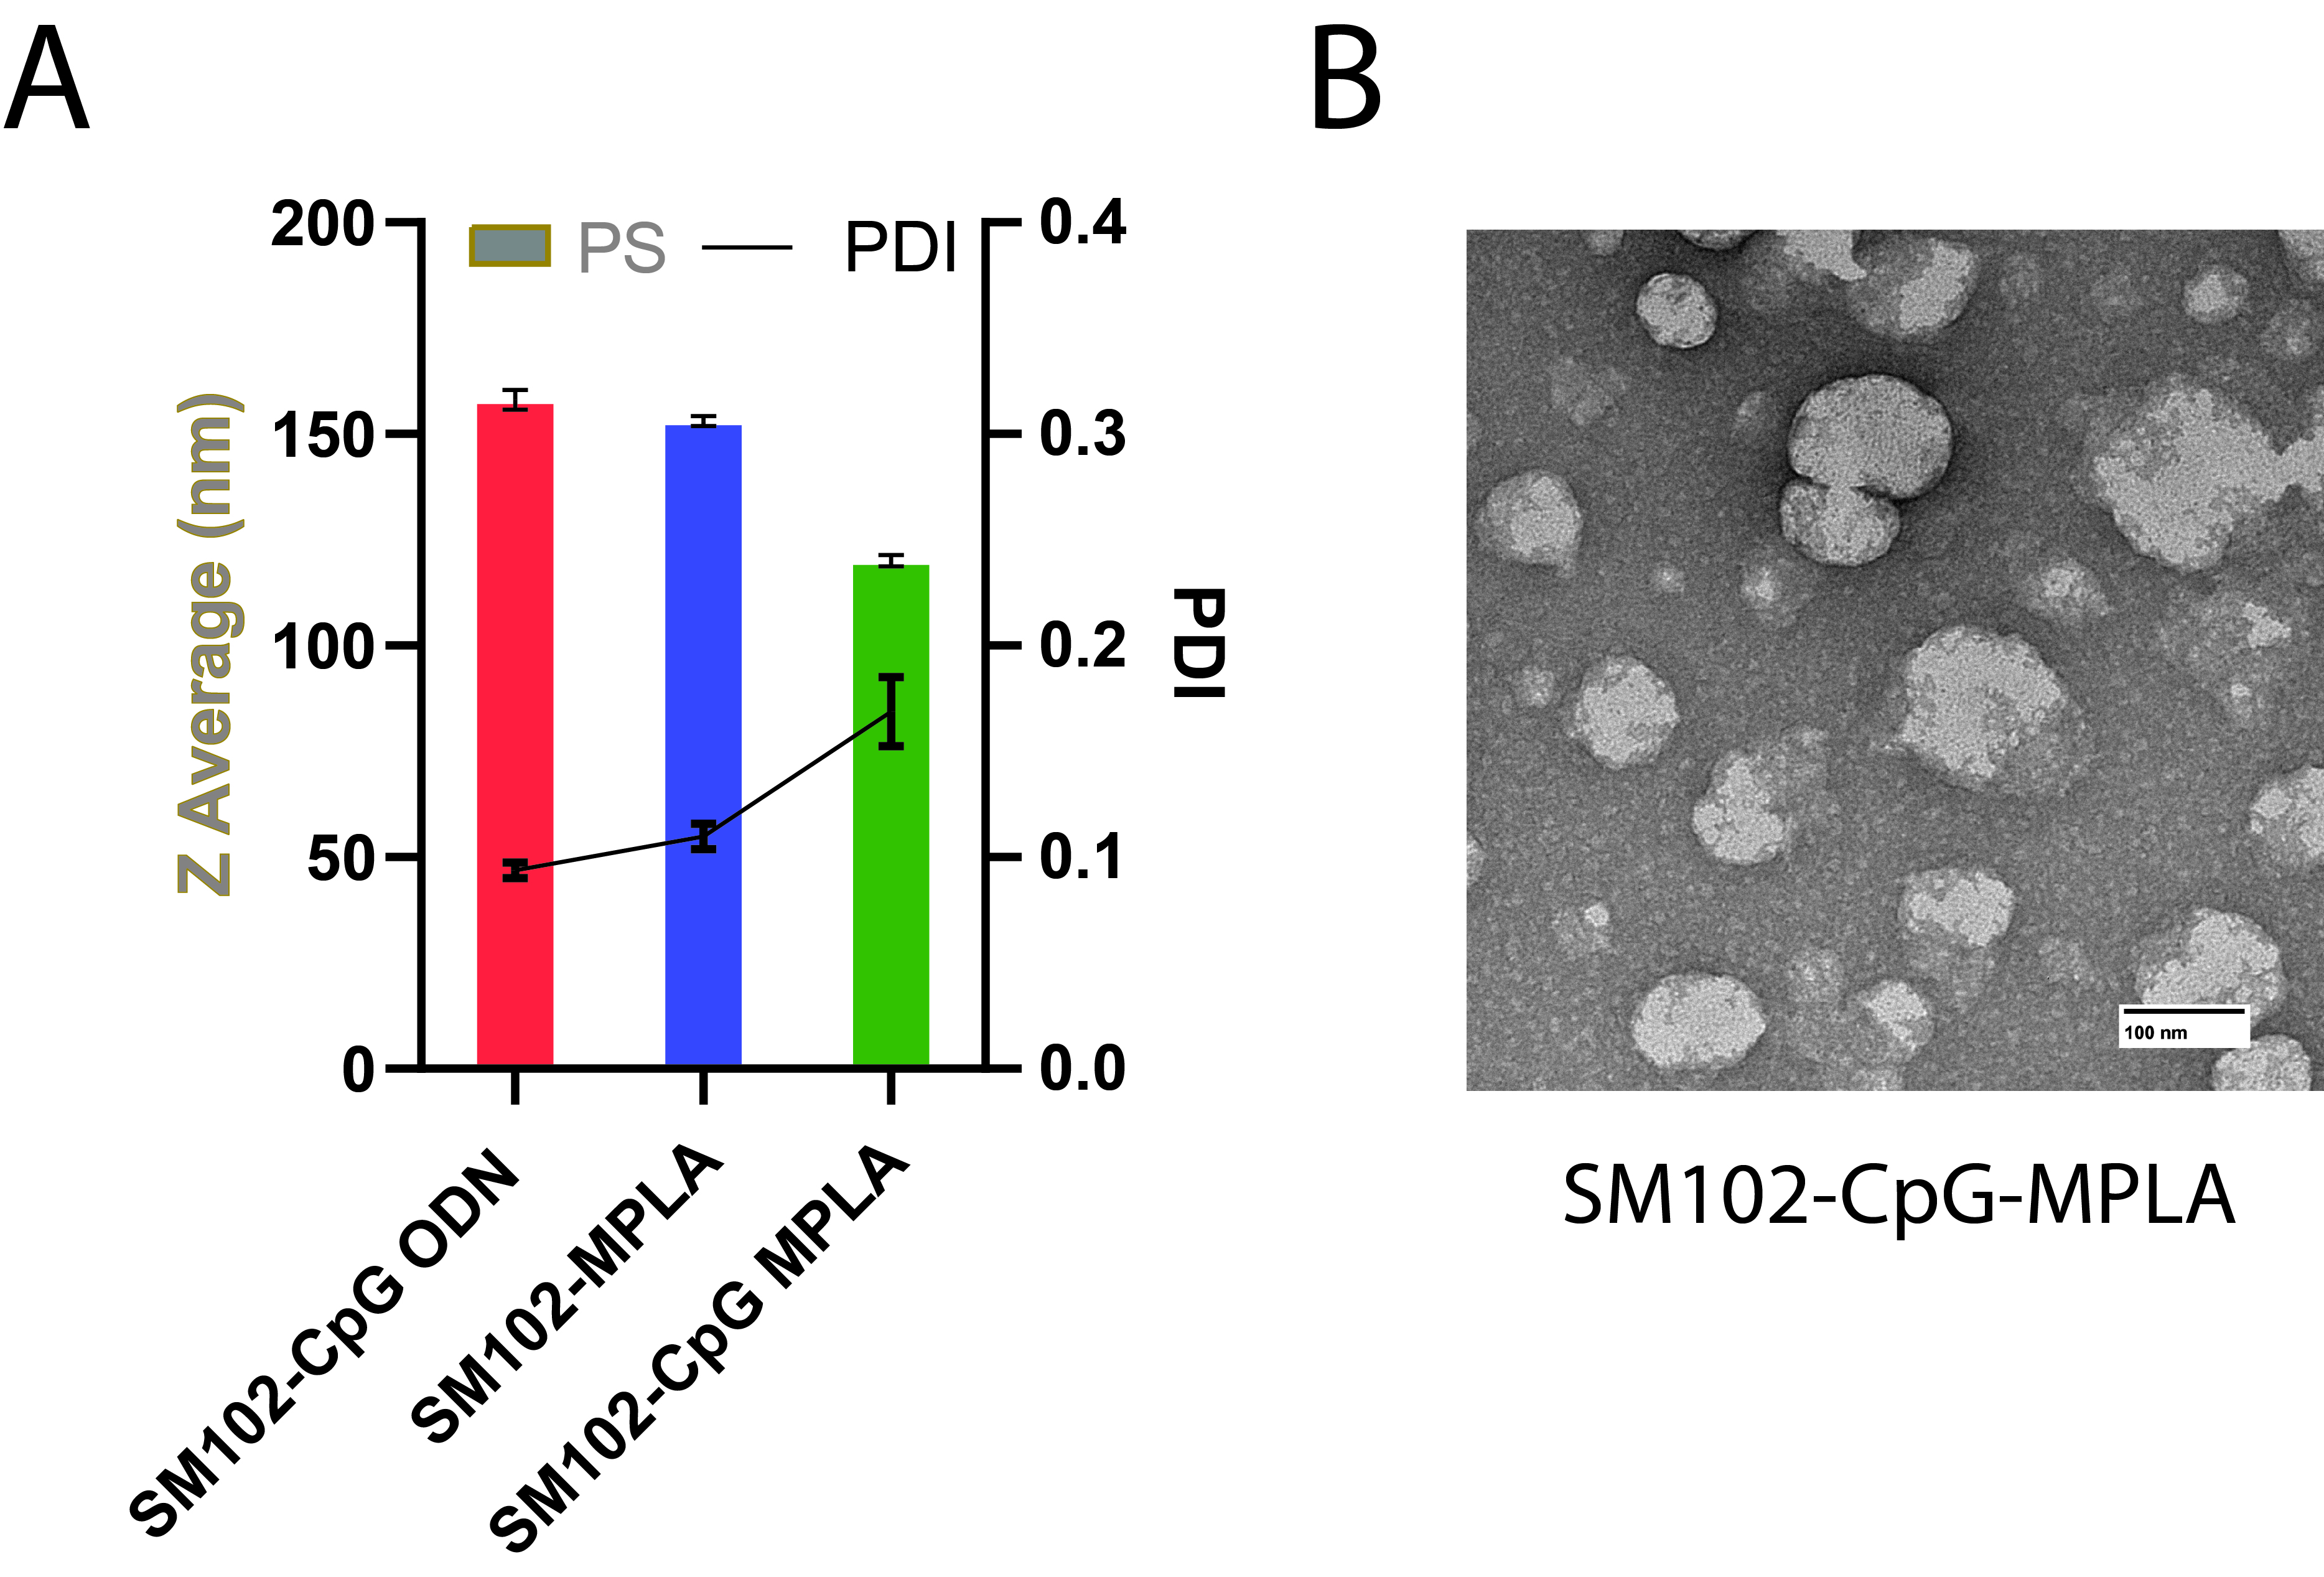 Fig. 1. Morphological characterization of adjuvanted LNPs containing ionizable lipid SM102. A) The particle size of the LNPs measured using dynamic light scattering and the hydrodynamic diameter is reported as Z average (nm). Data are presented as the mean ± SD (n=4). B) Negative stained TEM images of dual adjuvanted SM102-CpG-MPLA LNPs. The scale bar is 100 nm.
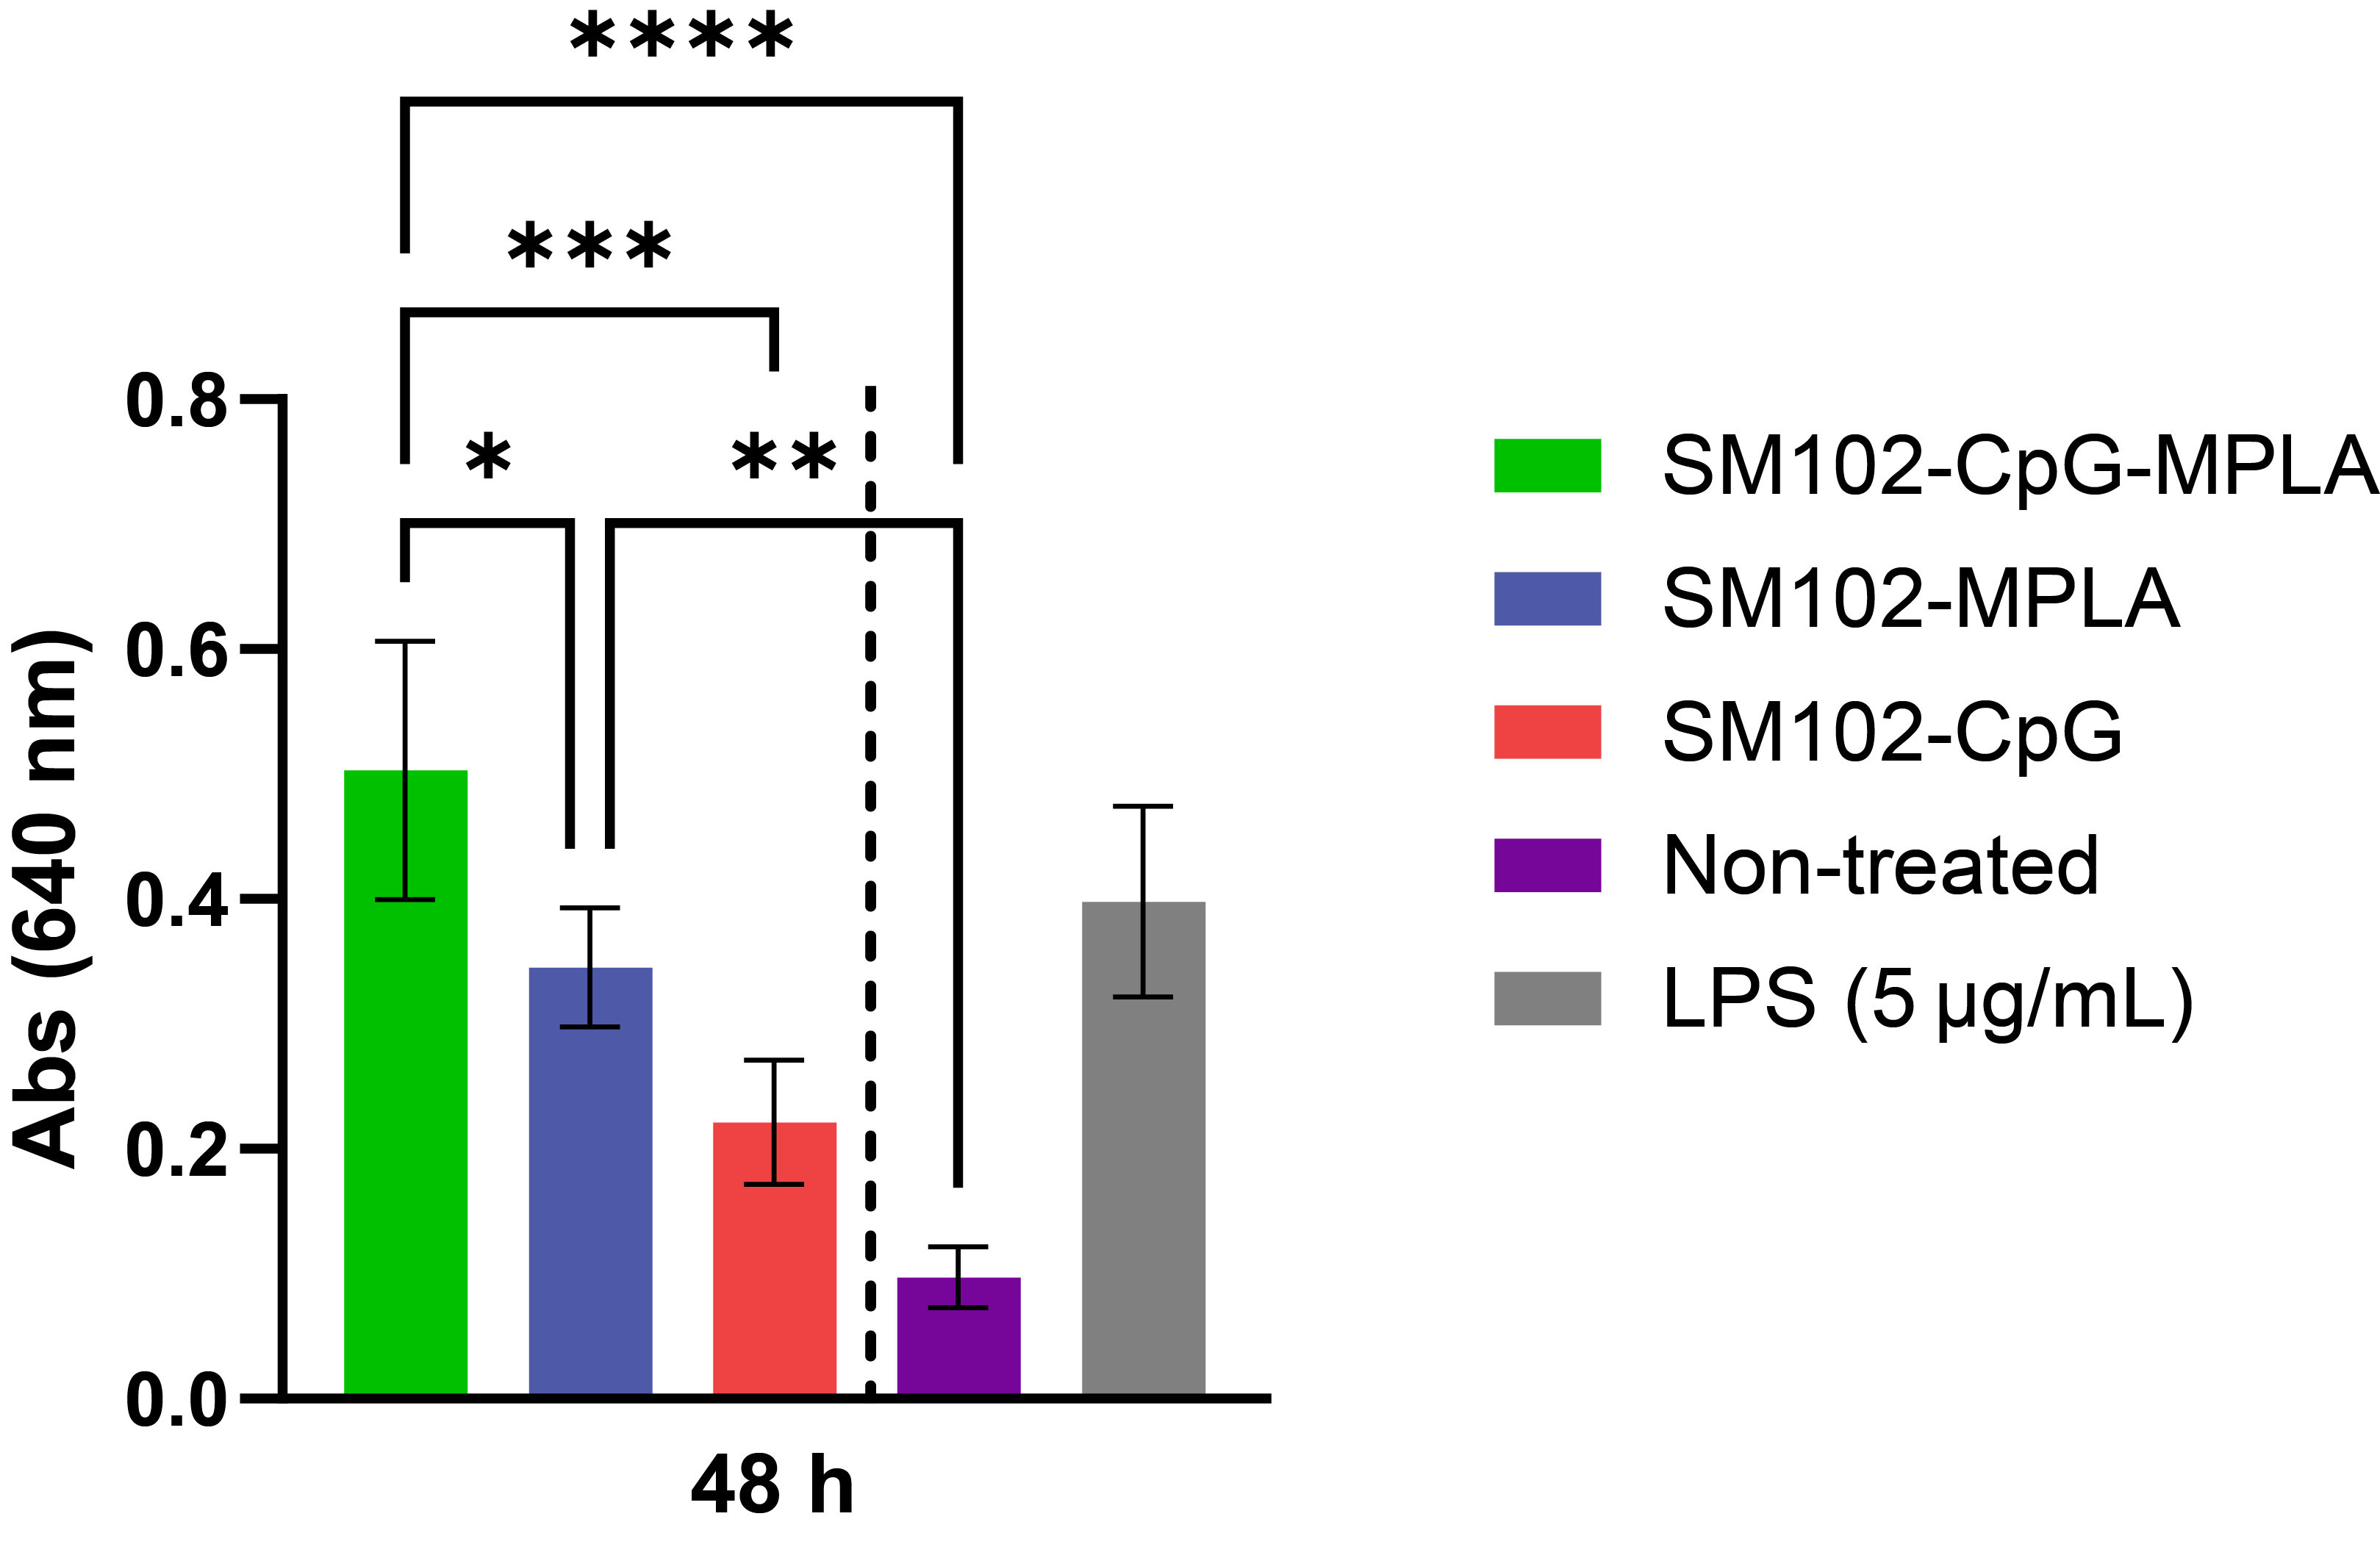 Fig. 2. Secreted embryonic alkaline phosphatase (SEAP) activity of CpG ODN (2.5 µg/mL), MPLA (1.25 µg/mL), and CpG-MPLA (2.5 µg/mL of CpG ODN and 1.25 µg/mL of MPLA) loaded SM102 LNPs after 48 hours of treatment with Raw-Blue™ Cells. Y-axis indicates absorption intensity at 640 nm, directly proportional to the SEAP activity of the samples containing Adjuvants in LNPs. Data are presented as the mean ± SD (n=4). Significant differences between each treatment group were determined by one-way ANOVA with Tukey’s multiple comparison test, *p = 0.0373, **p = 0.0024, ***p = 0.0003, ****p < 0.0001.
 .jpg) Fig. 3. Analysis of surface marker expression and secreted TNF-α levels. BMDCs were treated with SM102-CpG (10 µg/mL), SM102-MPLA (5 µg/mL) and SM102-CpG-MPLA (10 µg/mL of CpG and 5 µg/mL MPLA) for 24 h. After that surface marker expressions of A) CD40, B) CD80 and C) CD86 were measured using flow cytometry analysis and D) Supernatants were measured for TNF-α using ELISA. Data are presented as the mean ± SD (n=4). Significant differences between each treatment group were determined by one-way ANOVA with Tukey’s multiple comparison test, *p < 0.05, **p < 0.01, ***p < 0.001, ****p < 0.0001.
Fig. 3. Analysis of surface marker expression and secreted TNF-α levels. BMDCs were treated with SM102-CpG (10 µg/mL), SM102-MPLA (5 µg/mL) and SM102-CpG-MPLA (10 µg/mL of CpG and 5 µg/mL MPLA) for 24 h. After that surface marker expressions of A) CD40, B) CD80 and C) CD86 were measured using flow cytometry analysis and D) Supernatants were measured for TNF-α using ELISA. Data are presented as the mean ± SD (n=4). Significant differences between each treatment group were determined by one-way ANOVA with Tukey’s multiple comparison test, *p < 0.05, **p < 0.01, ***p < 0.001, ****p < 0.0001.