
Manufacturing and Analytical Characterization - Biomolecular
Mandy (Maria) Janssen Blankenship, PhD (she/her/hers)
Scientific Group Lead
NanoImaging Services
San Diego, California, United States
Mandy (Maria) Janssen Blankenship, PhD (she/her/hers)
Scientific Group Lead
NanoImaging Services
San Diego, California, United States
Daphne Tortoles, BS
microscopist
NanoImaging Services
San Diego, California, United States
Brianna Fisher, BS
microscopist
NanoImaging Services
San Diego, California, United States
Adriana Trujillo, Ph.D.
microscopist
NanoImaging Services
San Diego, California, United States
Karen Fong, BS
microscopist
NanoImaging Services
San Diego, California, United States
Giovana Scapin, Ph.D.
CSO
NanoImaging Services
Woburn, Massachusetts, United States
Brent Wood, Ph.D.
scientist
NanoImaging Services
San Diego, California, United States
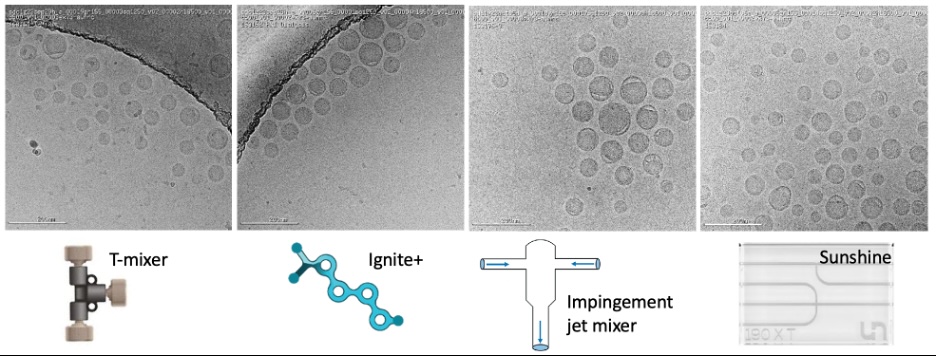 Figure 1. Cryo-TEM images of LNP formulations prepared using a T-mixer, the Ignite+, an impingement jet mixer, and the Sunshine.
 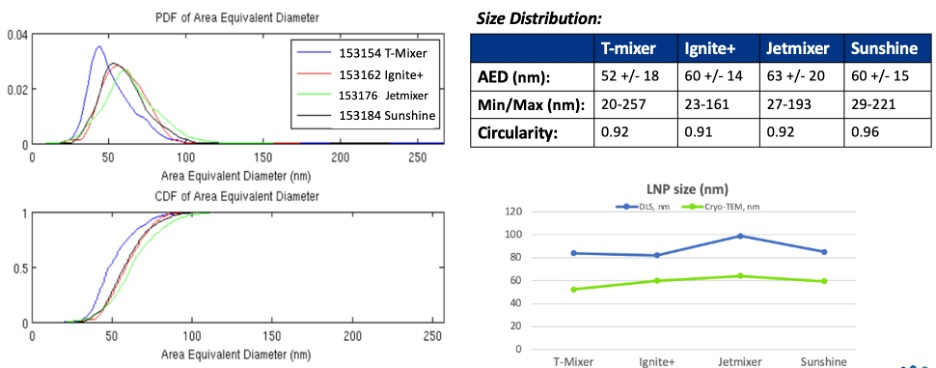 Figure 2. Size measurements of LNPs following image analyses of cryo-TEM images. Left: plots showing the probability distribution function (top) and cumulative distribution function (bottom. Right: Mean Area Equivalent Diameter (AED), range, and circularity calculated for each of the four LNP preparations (top); The average diameters calculated from cryo-TEM data compared DLS measurements (bottom).
 .jpg) Figure 3. Size and morphology analysis data for LNPs encapsulating polyA and dialyzed into 20 mM Tris buffer, LNPs encapsulating polyA and buffer exchanged into 20 mM Tris buffer using tangential flow filtration, LNPs encapsulating polyA and dialyzed into TBS, and LNPs encapsulating hEPO mRNA and dialyzed into 20 mM Tris buffer. Representative images of LNPs in low ionic strength buffer versus high ionic strength buffer are shown in the lower right panel.
Figure 3. Size and morphology analysis data for LNPs encapsulating polyA and dialyzed into 20 mM Tris buffer, LNPs encapsulating polyA and buffer exchanged into 20 mM Tris buffer using tangential flow filtration, LNPs encapsulating polyA and dialyzed into TBS, and LNPs encapsulating hEPO mRNA and dialyzed into 20 mM Tris buffer. Representative images of LNPs in low ionic strength buffer versus high ionic strength buffer are shown in the lower right panel.