
Formulation and Delivery - Biomolecular
 photo")
Esraa Mohamed, MS (she/her/hers)
PhD Graduate candidate
University of Iowa
Iowa City, Iowa, United States
Esraa Mohamed, MS (she/her/hers)
PhD Graduate candidate
University of Iowa
Iowa City, Iowa, United States
Andrea Adamcakova-Dodd, Ph.D.
Asst Research Scientist
University of Iowa
Iowa City, Iowa, United States
Isabella Grumbach, Ph.D.
Departmental Executive Officer
University of Iowa
Iowa City, Iowa, United States
Peter Thorne, Ph.D.
Professor, Occupational & Environmental Health department
University of Iowa
Iowa City, Iowa, United States
Xuefang Jing, Ph.D.
Research Assistant, Occupational & Environmental Health department
University of Iowa
Iowa City, Iowa, United States

Aliasger K. Salem, Ph.D.
Associate Vice President for Research
University of Iowa
Iowa City, Iowa, United States
.jpg) Figure 1: Pulmonary resistance (A), differential cell counts (B) of in the BALF of animal groups unexposed and exposed to different chlorine gas concentrations (values represent means ± SD). Statistical analysis was performed using one-way ANOVA, followed by Tukey’s post-hoc test. P-values of less than or equal to 0.05 were considered significant., *p <0.05, ** p <0.01, ***p <0.001, ****p <0.0001.
Figure 1: Pulmonary resistance (A), differential cell counts (B) of in the BALF of animal groups unexposed and exposed to different chlorine gas concentrations (values represent means ± SD). Statistical analysis was performed using one-way ANOVA, followed by Tukey’s post-hoc test. P-values of less than or equal to 0.05 were considered significant., *p <0.05, ** p <0.01, ***p <0.001, ****p <0.0001.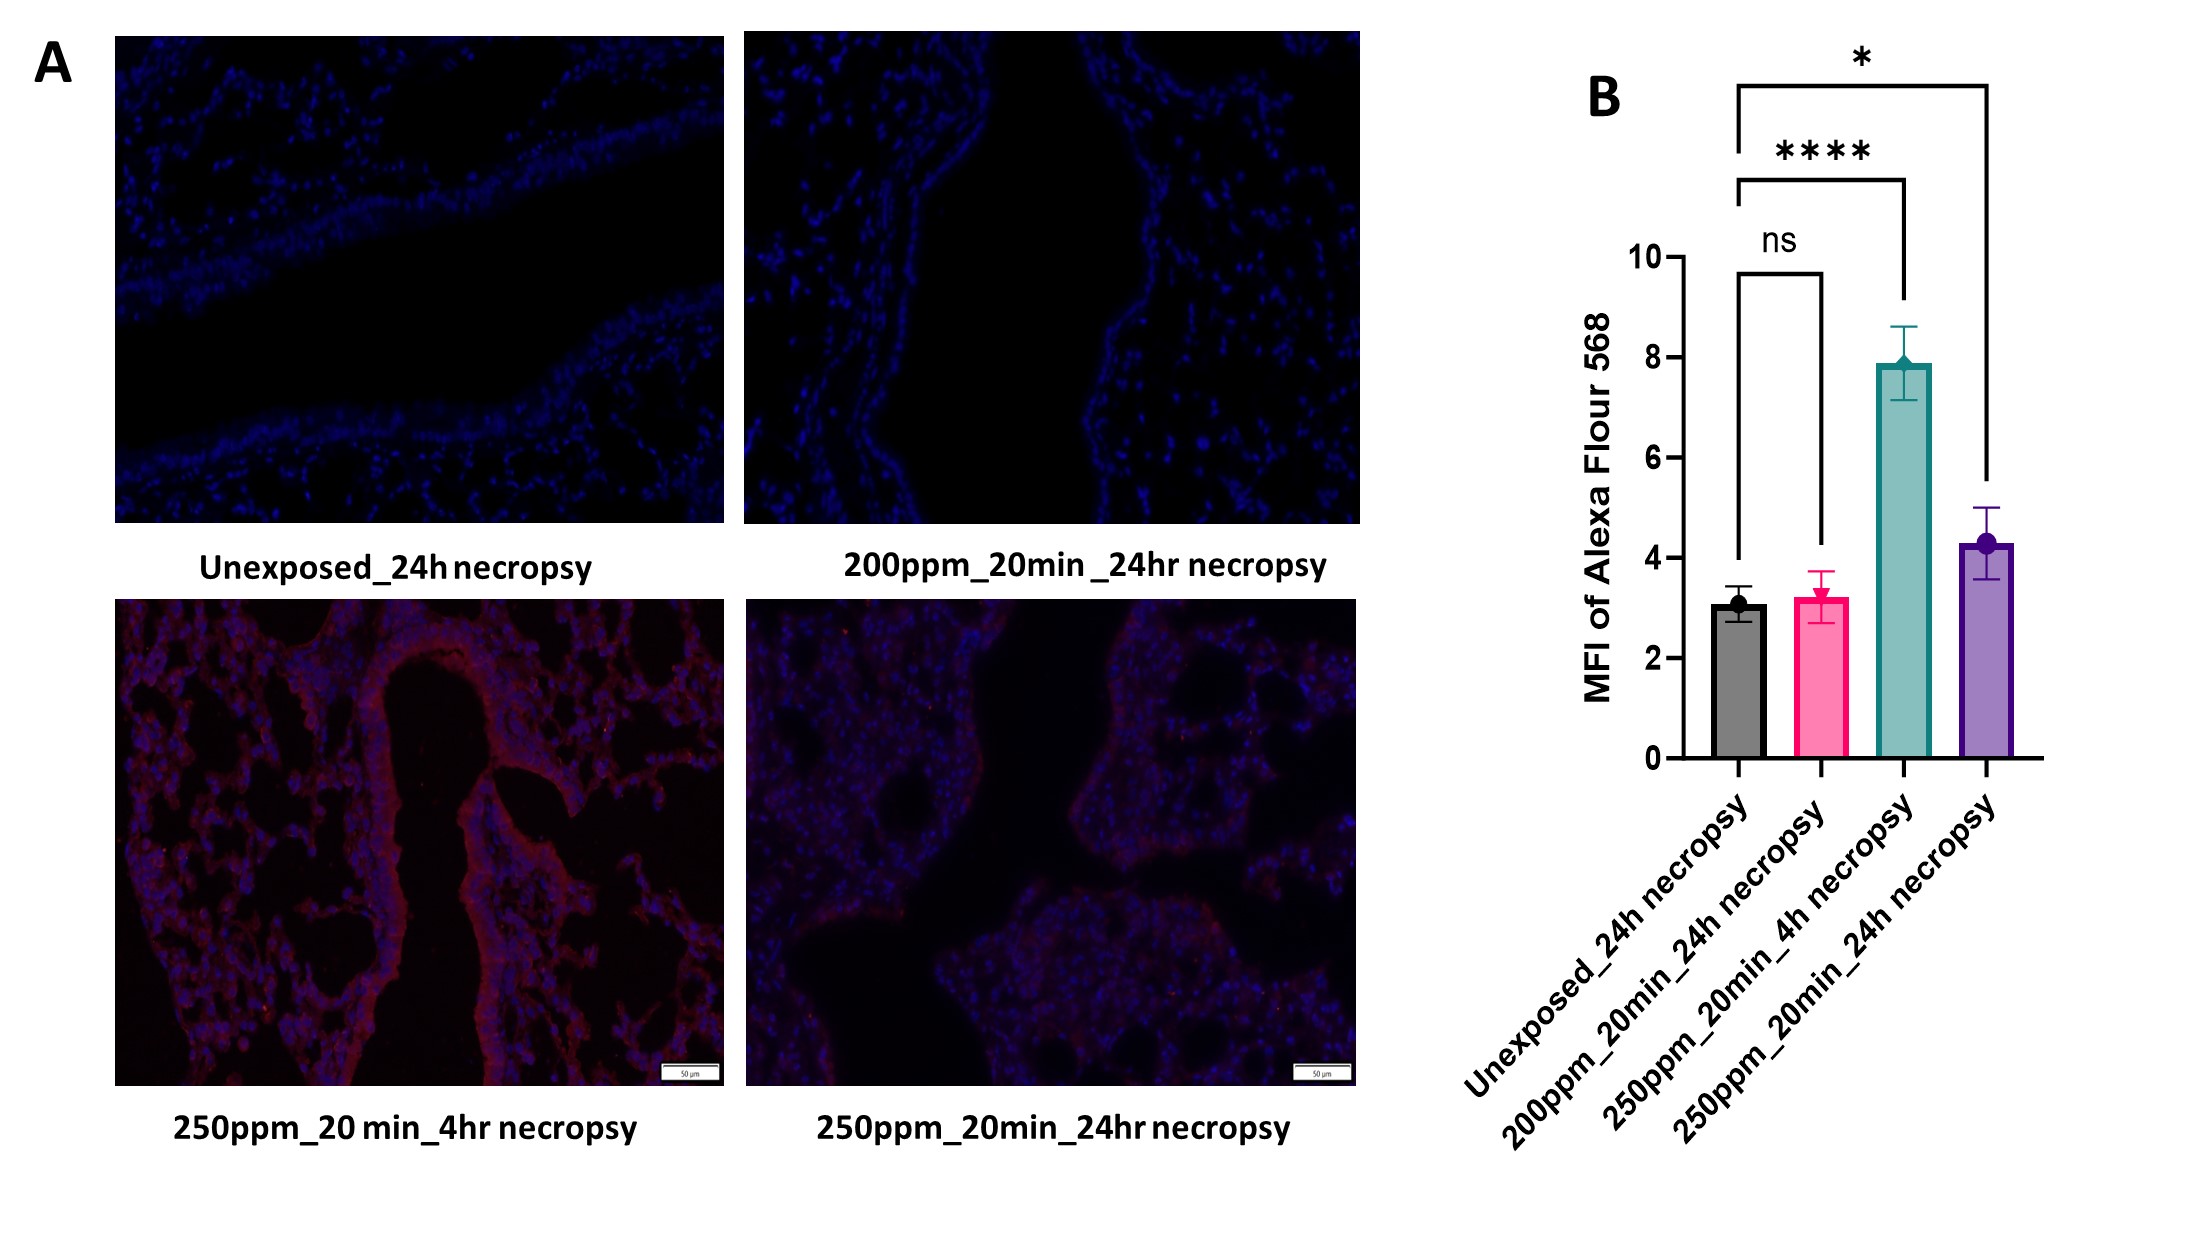 Figure 2: Fluorescence microscope images of lung tissues (A) and the mean fluorescence intensity measured by image J (B) of oxidized CaMKII levels in lung tissues unexposed and exposed to 200 ppm or 250 ppm chlorine concentration for 20 min measured by Alexa Flour 568 (values represent means ± SD). Statistical analysis was performed using one-way ANOVA, followed by Tukey’s post-hoc test. P-values of less than or equal to 0.05 were considered significant, *p <0.05, ** p <0.01, ***p <0.001, ****p <0.0001.
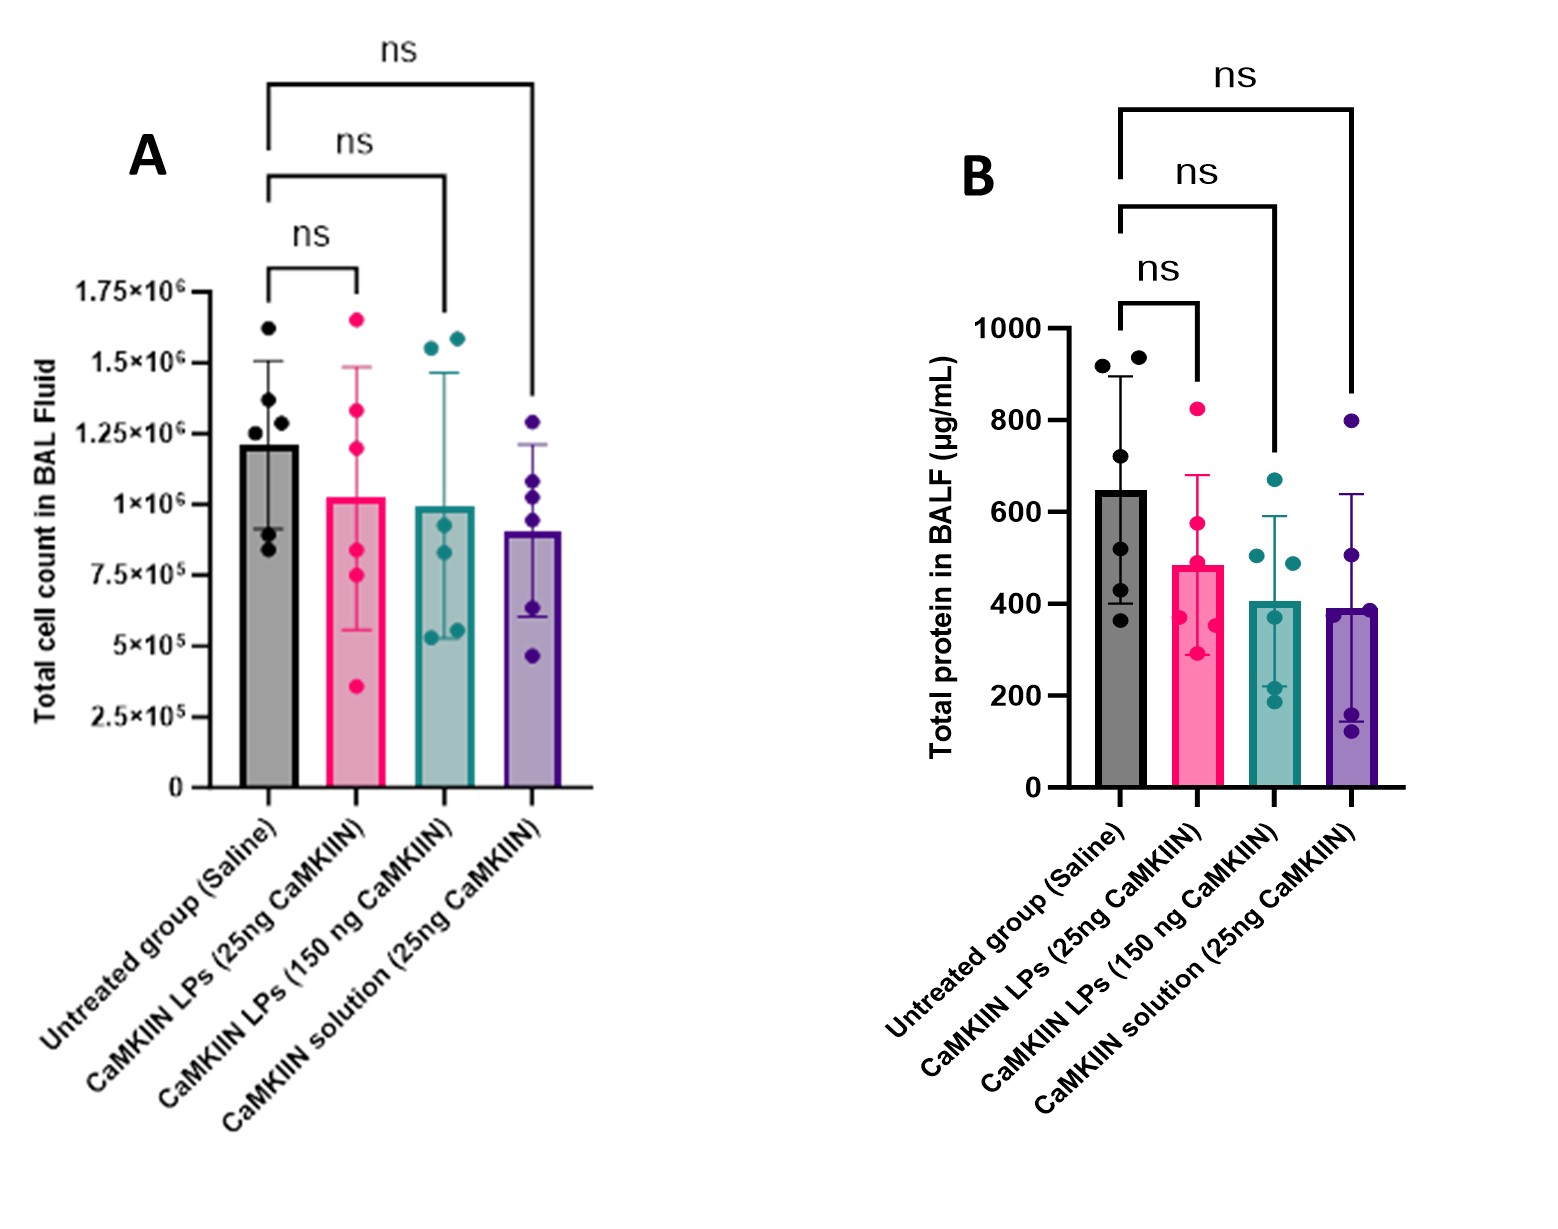 Figure 3: Total cell counts (A), and total protein concentrations measured using microBCA (B) in the BALF of exposed mice to 200 ppm for 20 min and receiving either saline or CaMKIIN treatment (values represent means ± SD). Statistical analysis was done using one-way ANOVA, followed by Tukey’s post-hoc test. P-values of less than or equal to 0.05 were considered significant.