
Formulation and Delivery - Chemical
Taehyung Kim, MS
Senior Research Scientist III
Chong Kun Dang Pharmaceutical Corp.
Yongin, Kyonggi-do, Republic of Korea
MinYoung Kim, MS
Senior Research Scientist I
Chong Kun Dang Pharmaceutical Corp.
Yongin, Kyonggi-do, Republic of Korea
SungKyun Han, Ph.D.
Principal Research Scientist I
Chong Kun Dang Pharmaceutical Corp.
Yongin, Kyonggi-do, Republic of Korea
.jpg) Figure 1. In vitro release profiles of (A) lobeglitazone and (B) sitagliptin using a flow through cell dissolution tester in a pH 1.2 buffer solution, and average plasma concentration vs. time profiles of (A) lobeglitazone and (B) sitagliptin following oral administration of phase 1 reference drugs and CKD-396 test formulations.
Figure 1. In vitro release profiles of (A) lobeglitazone and (B) sitagliptin using a flow through cell dissolution tester in a pH 1.2 buffer solution, and average plasma concentration vs. time profiles of (A) lobeglitazone and (B) sitagliptin following oral administration of phase 1 reference drugs and CKD-396 test formulations.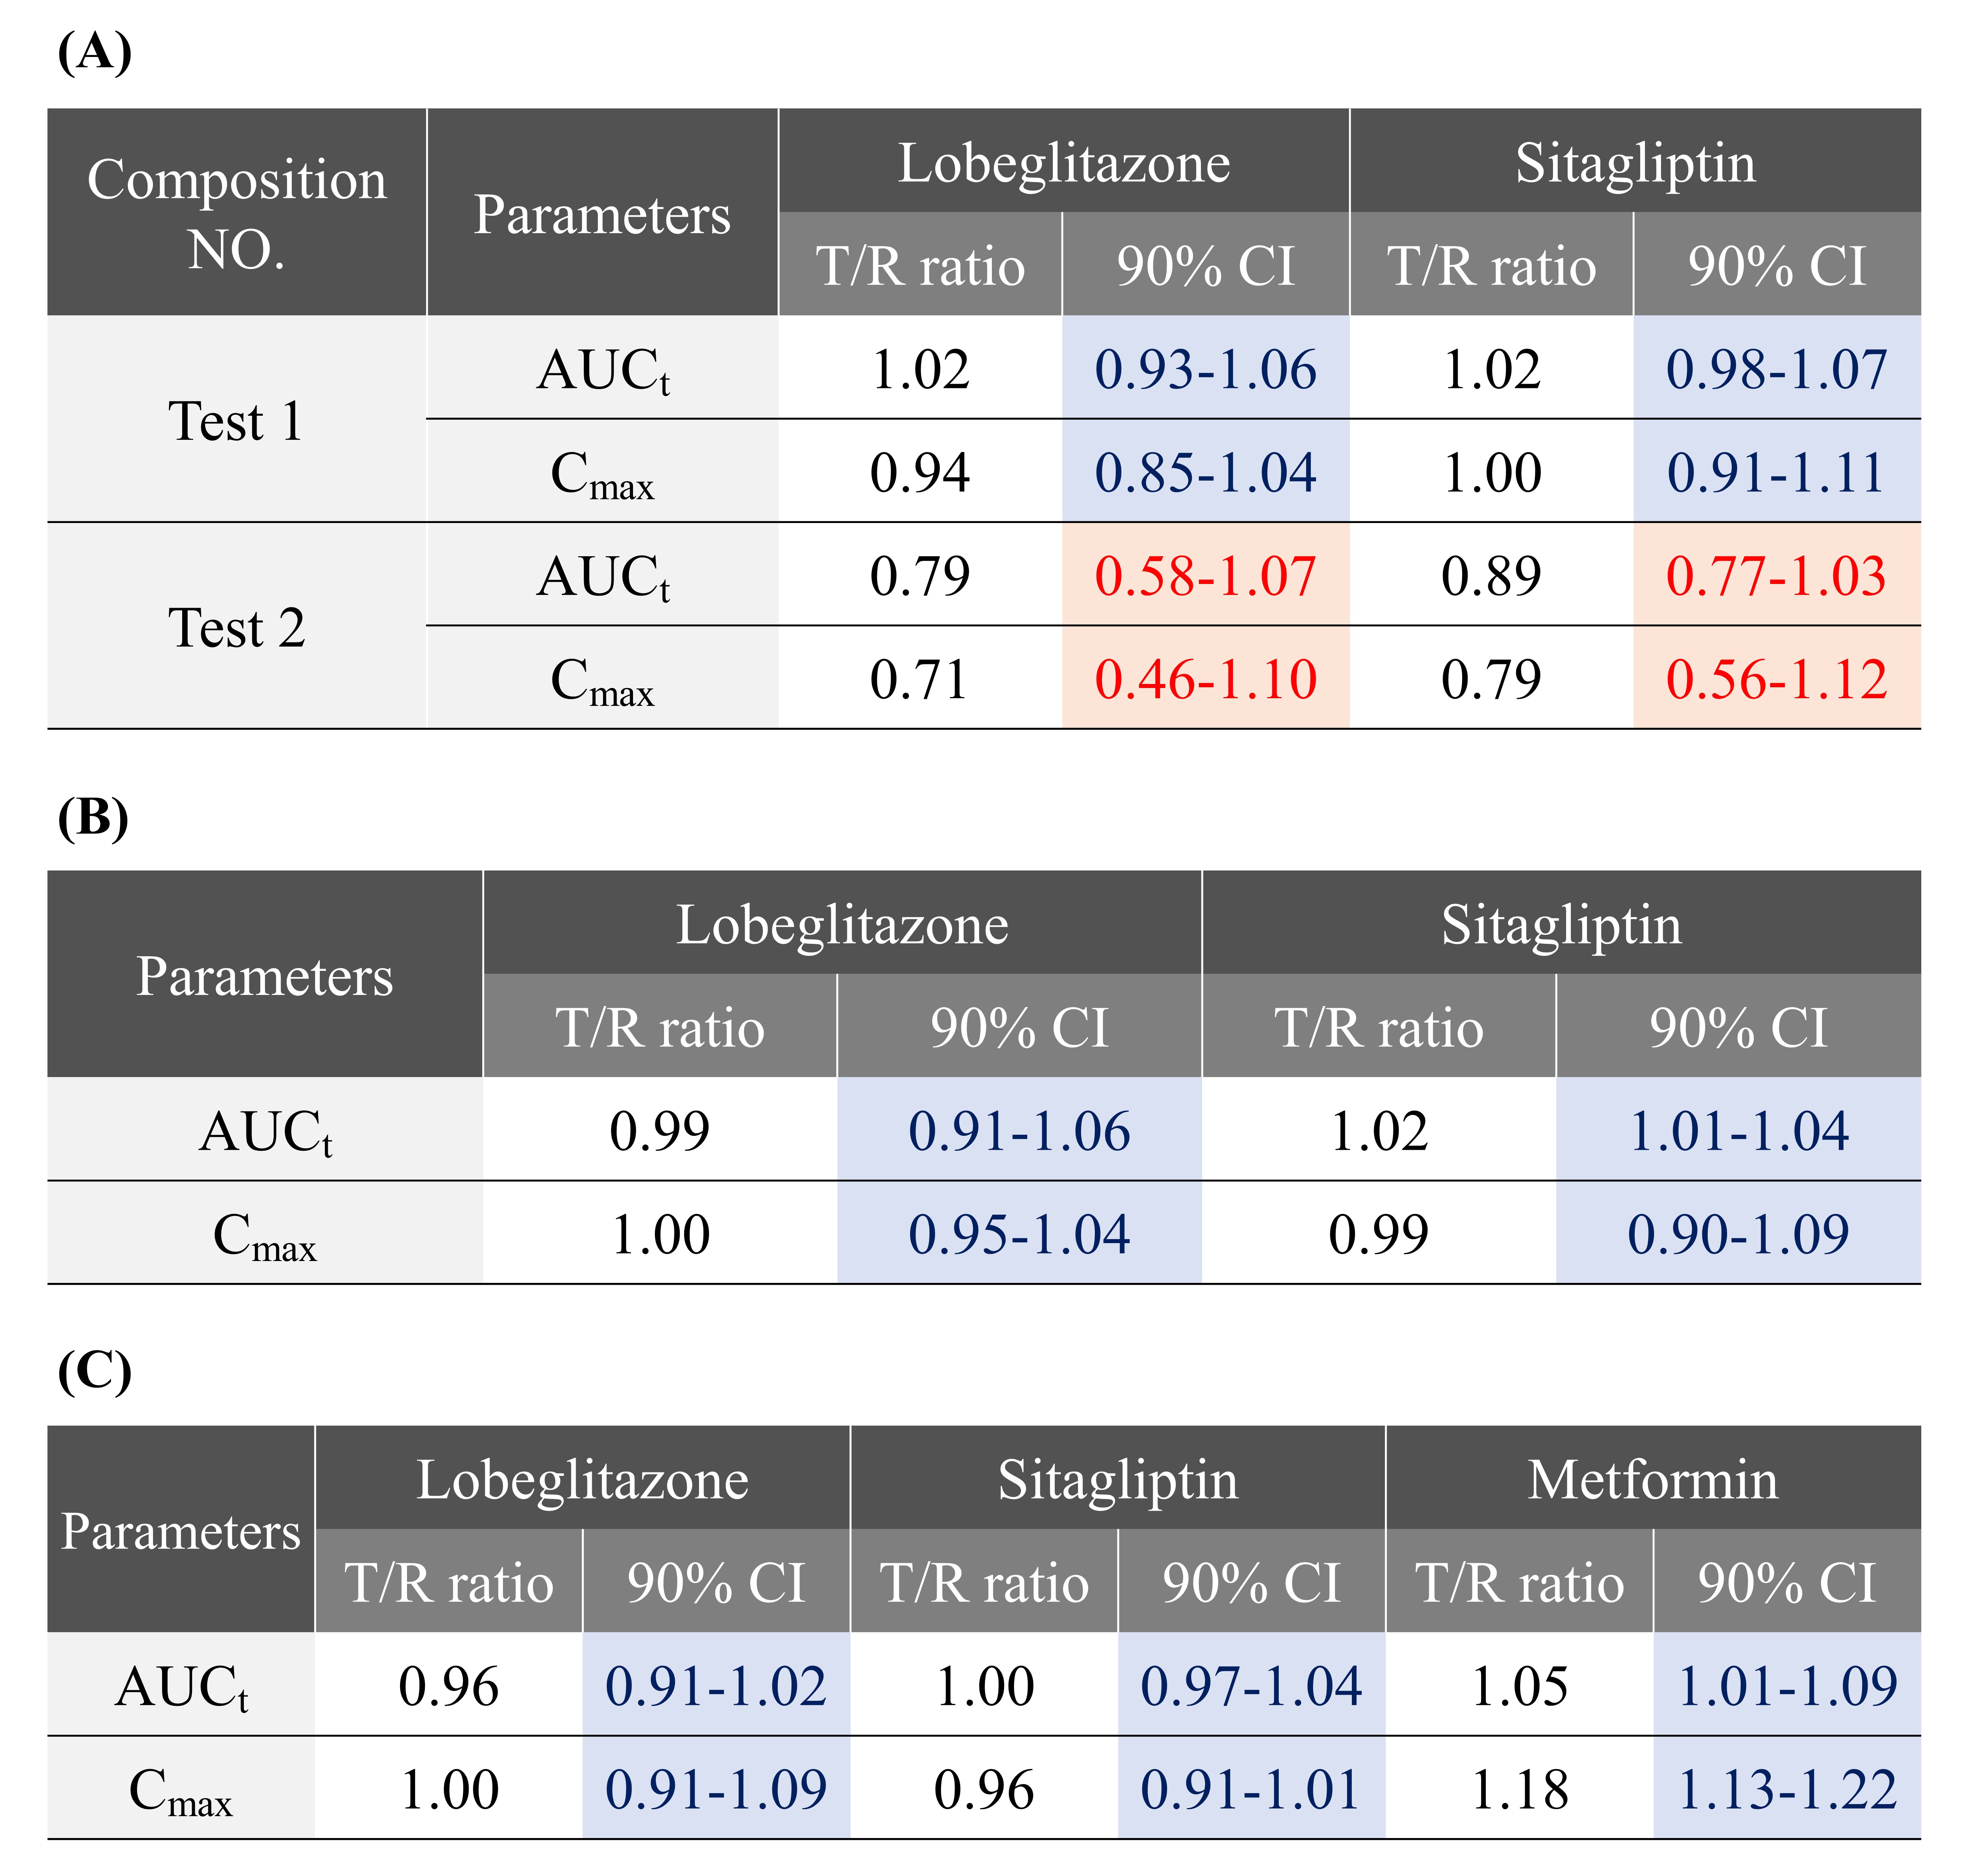 Table 1. Geometric mean test/reference ratios and 90% confidence intervals for log-transformed pharmacokinetic parameters (Cmax and AUCt) between the test and reference drugs. (A) Results of preclinical pharmacokinetic study of CKD-396 test 1 and 2 compositions, (B) Results of phase 1 bioequivalence study of CKD-396, and (C) Results of phase 1 bioequivalence study of CKD-393.
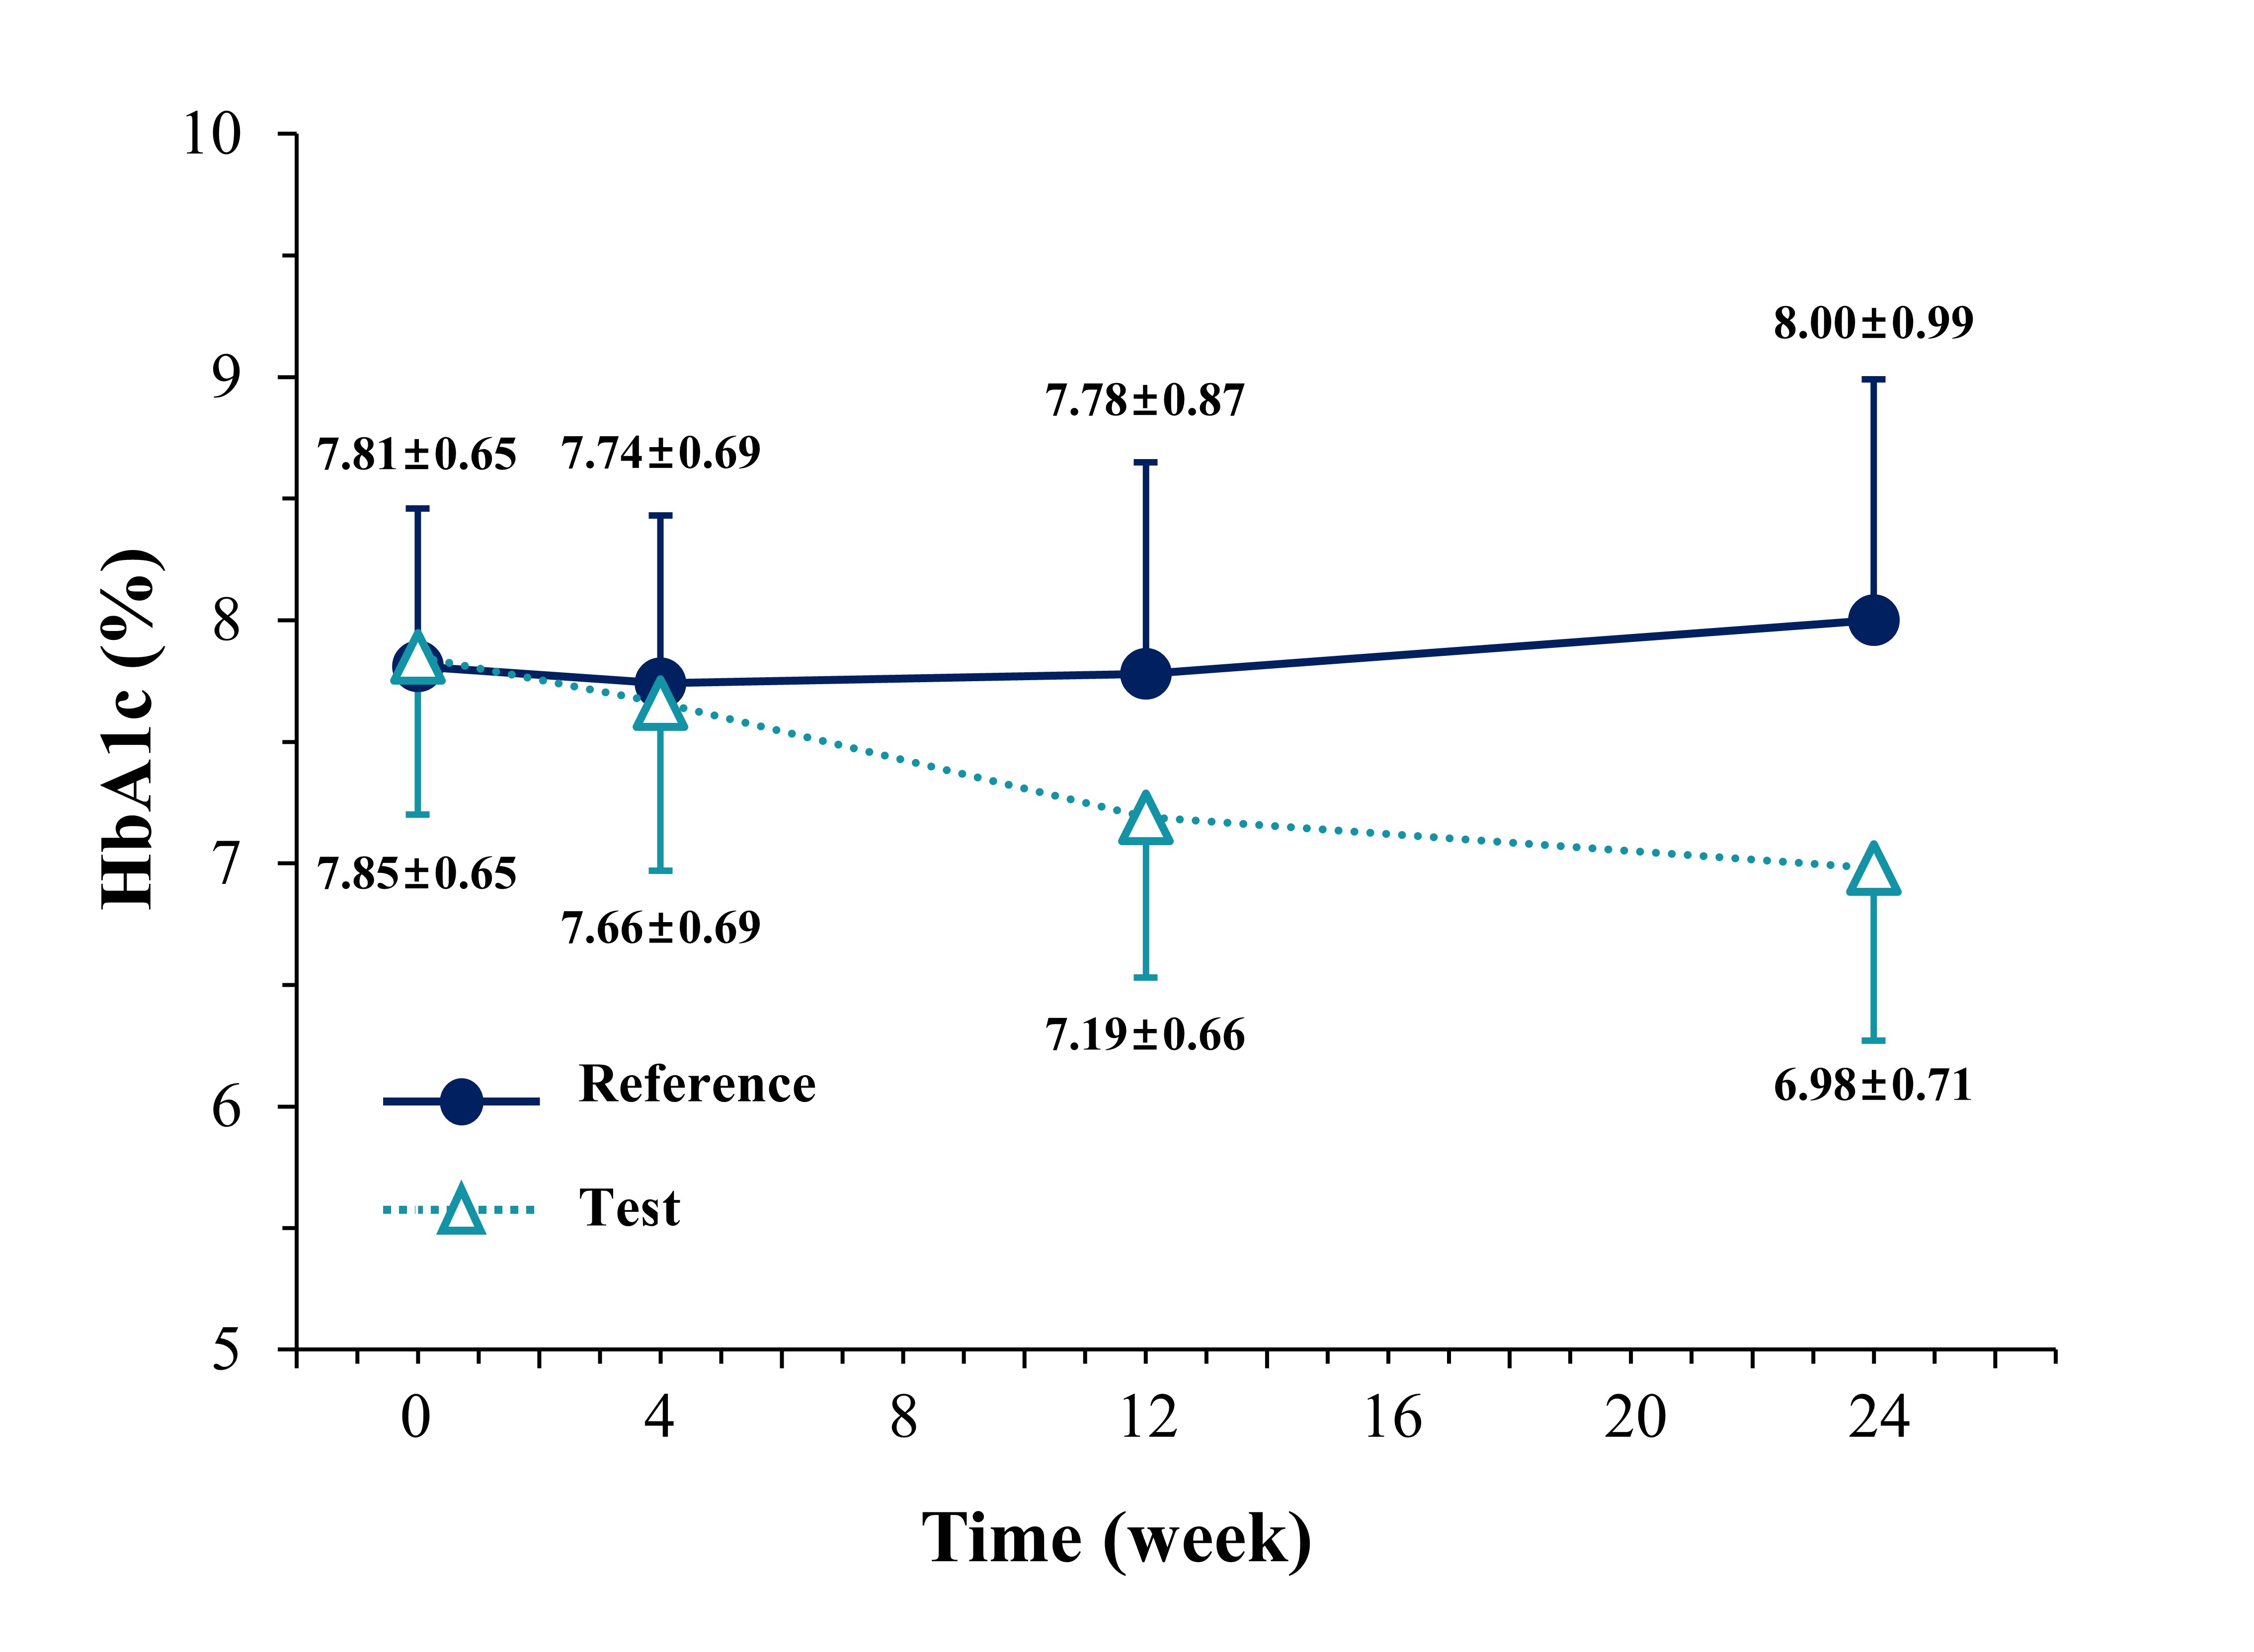 Figure 2. Temporal changes in HbA1c levels (%) at baseline and 4, 12, and 24 weeks of follow-up in T2DM patients (n=231) insufficiently controlled with metformin and sitagliptin. Both groups received metformin hydrochloride (≥1,000 mg) and sitagliptin 100 mg. The control group received a placebo for lobeglitazone sulfate, while the test group received lobeglitazone sulfate 0.5 mg.