
Formulation and Delivery - Chemical
Hannah Cleary, MPharm
PhD Student
Trinity College Dublin
Dublin, Dublin, Ireland
Hannah Cleary, MPharm
PhD Student
Trinity College Dublin
Dublin, Dublin, Ireland
Tim Persoons, Ph.D.
Associate Professor
Trinity College Dublin
Dublin, Dublin, Ireland

Nikoletta Fotaki, Ph.D.
Professor of Biopharmaceutics
University of Bath
Bath, England, United Kingdom
Deirdre M M. D'Arcy, Ph.D.
Associate Professor
Trinity College Dublin
Dublin, Dublin, Ireland
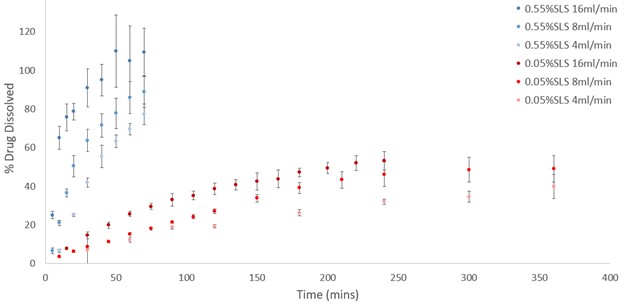 Figure 1: Dissolution in USP IV FTA with 0.55% SLS under three flow rates: 16ml/min (dark blue), 8ml/min (medium blue), 4ml/min (light blue); and with 0.05% SLS under three flow rates: 16ml/min (dark red), 8ml/min (medium red), 4ml/min (light red).
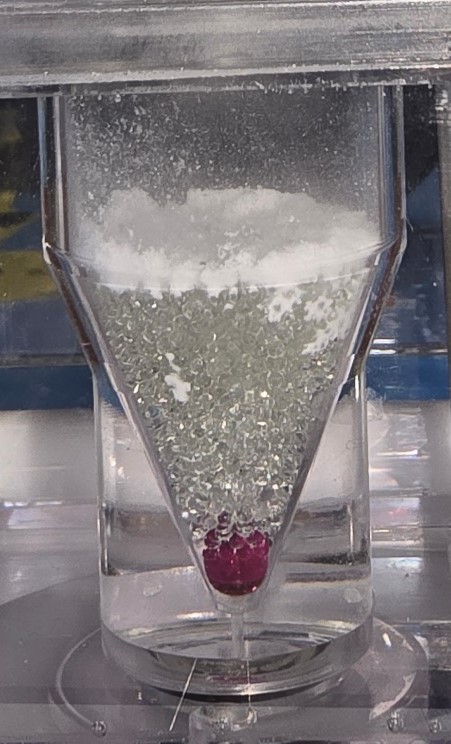 Figure 2: Photograph of the FTA cell during 8ml/min 0.05% SLS in vitro dissolution at 14 minutes.
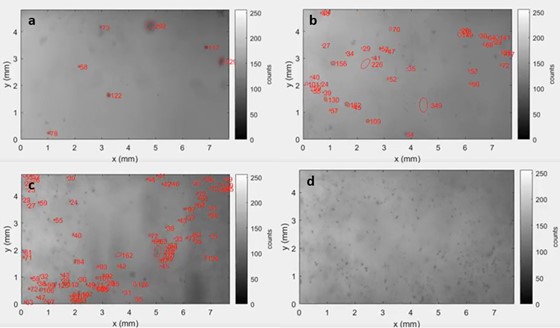 Figure 3: A screenshot from the 60-minute time point of 0.05% SLS dissolutions at: a) 16ml/min, (a typical frame with larger, easily detected particles); b) 8ml/min, Th 0.1, false positives evident; and c) 4ml/min frame at 13 seconds showing particle detections d) 4ml/min frame at 11 seconds (a typical frame at this flow rate with many small undetected particles).