
Preclinical, Clinical, and Translational Sciences
Yunming Xu, Pharm.D.
Biopharmaceutics Reviewer
US Food and Drug Administration
Silver Spring, Maryland, United States
Md Haider Ali, Ph.D.
ORISE Fellow
US Food and Drug Administration
Silver Spring, Maryland, United States
Ishwor Poudel, Ph.D.
ORISE Fellow
US Food and Drug Administration
St Louis, Missouri, United States
Parnali Chatterjee, Ph.D.
Pharmacologist
US Food and Drug Administration
Silver Spring, Maryland, United States
Zongming Gao, Ph.D.
Research Chemist
US Food and Drug Administration
St Louis, Missouri, United States
Bhagwant Rege, Ph.D.
Division Director
US Food and Drug Administration
Silver Spring, Maryland, United States
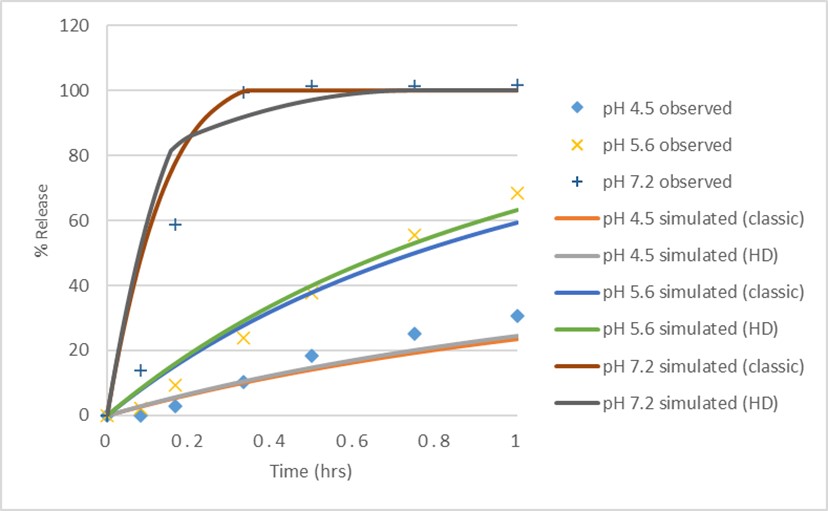 Figure 1: Simulated and observed dissolution profiles using P-PSD classic vs P-PSD HD models in pH 5.6 medium, pH 4.5 medium, and pH 7.2 medium. P-PSD extracted from pH 5.6 dissolution data and prediction performance of P-PSD simulated curve assessed against pH 4.5 and pH 7.2 dissolution data.
 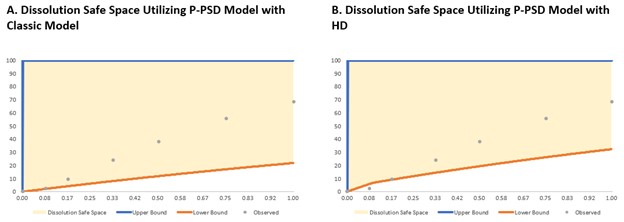 Figure 2: Optimization of dissolution safe space utilizing P-PSD model. For the classic model, as shown at Figure 2A, the upper bound of dissolution safe space was created by setting P-PSD to 1 µm at 100% for an instant complete release and the lower bound of dissolution safe space was created by setting P-PSD to 300 µm at 100% for very slow drug release. For the HD Model shown in Figure 2B, the P-PSD was set to 1 μm at 100% for an instant complete release to generate the upper bound of dissolution safe space and the lower bound of the dissolution safe space was modeled by two bins with 150 μm at 26% and 460 μm at 74%.
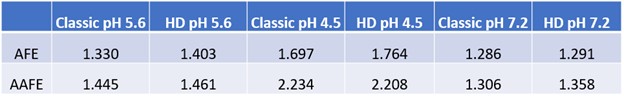 Table 1: AFE and AAFE for evaluating Goodness of Fit for P-PSD classic and P-PSD HD simulated dissolution curves vs observed in-vitro dissolution profiles.